Investing in ICOs requires due diligence and analysis of potential risks and returns. CoinDesk is its article named “The Seven Pillars of ICO Investing” has listed the most important pillars to consider before deciding to invest or not on any specific ICO project.
These 7 Pillars are the following:
- Team
- Idea
- Execution
- Legal/Regulatory Framework
- Tokenization
- ICO Structure
- Price Divers
What is interesting and should not be surprising though in the ICO investing is the fact that business models and marketing, promotional channels differ significantly in the amount of fundraising, as some business categories have in general twice the median funding compared to the smaller ones. The following statistic may be useful to investors as it represents the ICO categories with highest median funding. A higher amount of funding may be justified by future business prospects about what investors believe are the most promising trends that could be deliver desired returns on investments given the risks taken.
Categories with highest median funding in 2018:
- Blockchain Infrastructure
- Internet & Telecommunications
- Computing & Data Storage
- Data Analytics
- Asset Management
- Legal Services
- Social Media & Communication
- Supply & Logistics
- IT
- Identity & Reputation
These business categories are referenced not in random order, but from highest to lowest order of median funds raised. The Blockchain Infrastructure category has the highest median funds raised at $ 7,012,289, while the Identity & Reputation category has the lowest median funds raised in 2018 at $ 3,750,000. The first and last business categories have a significant difference between them in terms of median funds raised as the Blockchain Infrastructure category is 87% larger than the Identity & Reputation category.
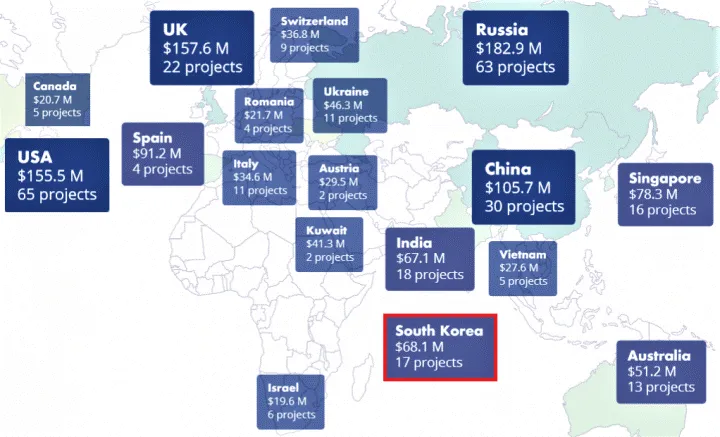
Another key interesting statistic in ICO investing is the geographical distribution of projects fundraising in the third quarter of 2018. The following infographic shows that there are again very large differences within continents. Europe and specifically Russia with $ 182.9 Million was the largest market, Israel with $19.6 Million was the smallest market, while South Korea witnessed a significant drop in fundraising as according to ICORating, in Q3 2018, 17 projects with South Korean origins raised USD 68 million, compared with 16 projects and USD 301 million in Q2 2018.
Geographical distribution of projects based on origin of the project team, Q3 2018

Country of origin means a country in which more than 50% of team members were living at the time of an ICO.
Another point worth mentioning is that in Q3 2018 USA had the largest number of projects compared to all mentioned countries in the above infographic, still Russia with a smaller number of projects, 63 was as mentioned the largest market.
 Vladislav Sopov
 Dan Burgin