Disclaimer: The opinions expressed by our writers are their own and do not represent the views of U.Today. The financial and market information provided on U.Today is intended for informational purposes only. U.Today is not liable for any financial losses incurred while trading cryptocurrencies. Conduct your own research by contacting financial experts before making any investment decisions. We believe that all content is accurate as of the date of publication, but certain offers mentioned may no longer be available.
Solana (SOL) has recently been making waves, and for good reason. With a 50% rally over the past month, analysts and investors are now keeping a close eye on this powerhouse. However, with such aggressive growth comes the question: is a price correction on the horizon?
Price analysis reveals some interesting trends. Solana's price jumped a staggering 11% on Oct. 20, 2023, and boasts a year-to-date gain of 170%, positioning it firmly as one of the top-performing crypto assets. This robust growth rate outstripped Ether (ETH), which it overshadowed on Oct. 20. By August 2023, SOL had already risen by 50% in just a month, with an impressive 150% increase for the year.
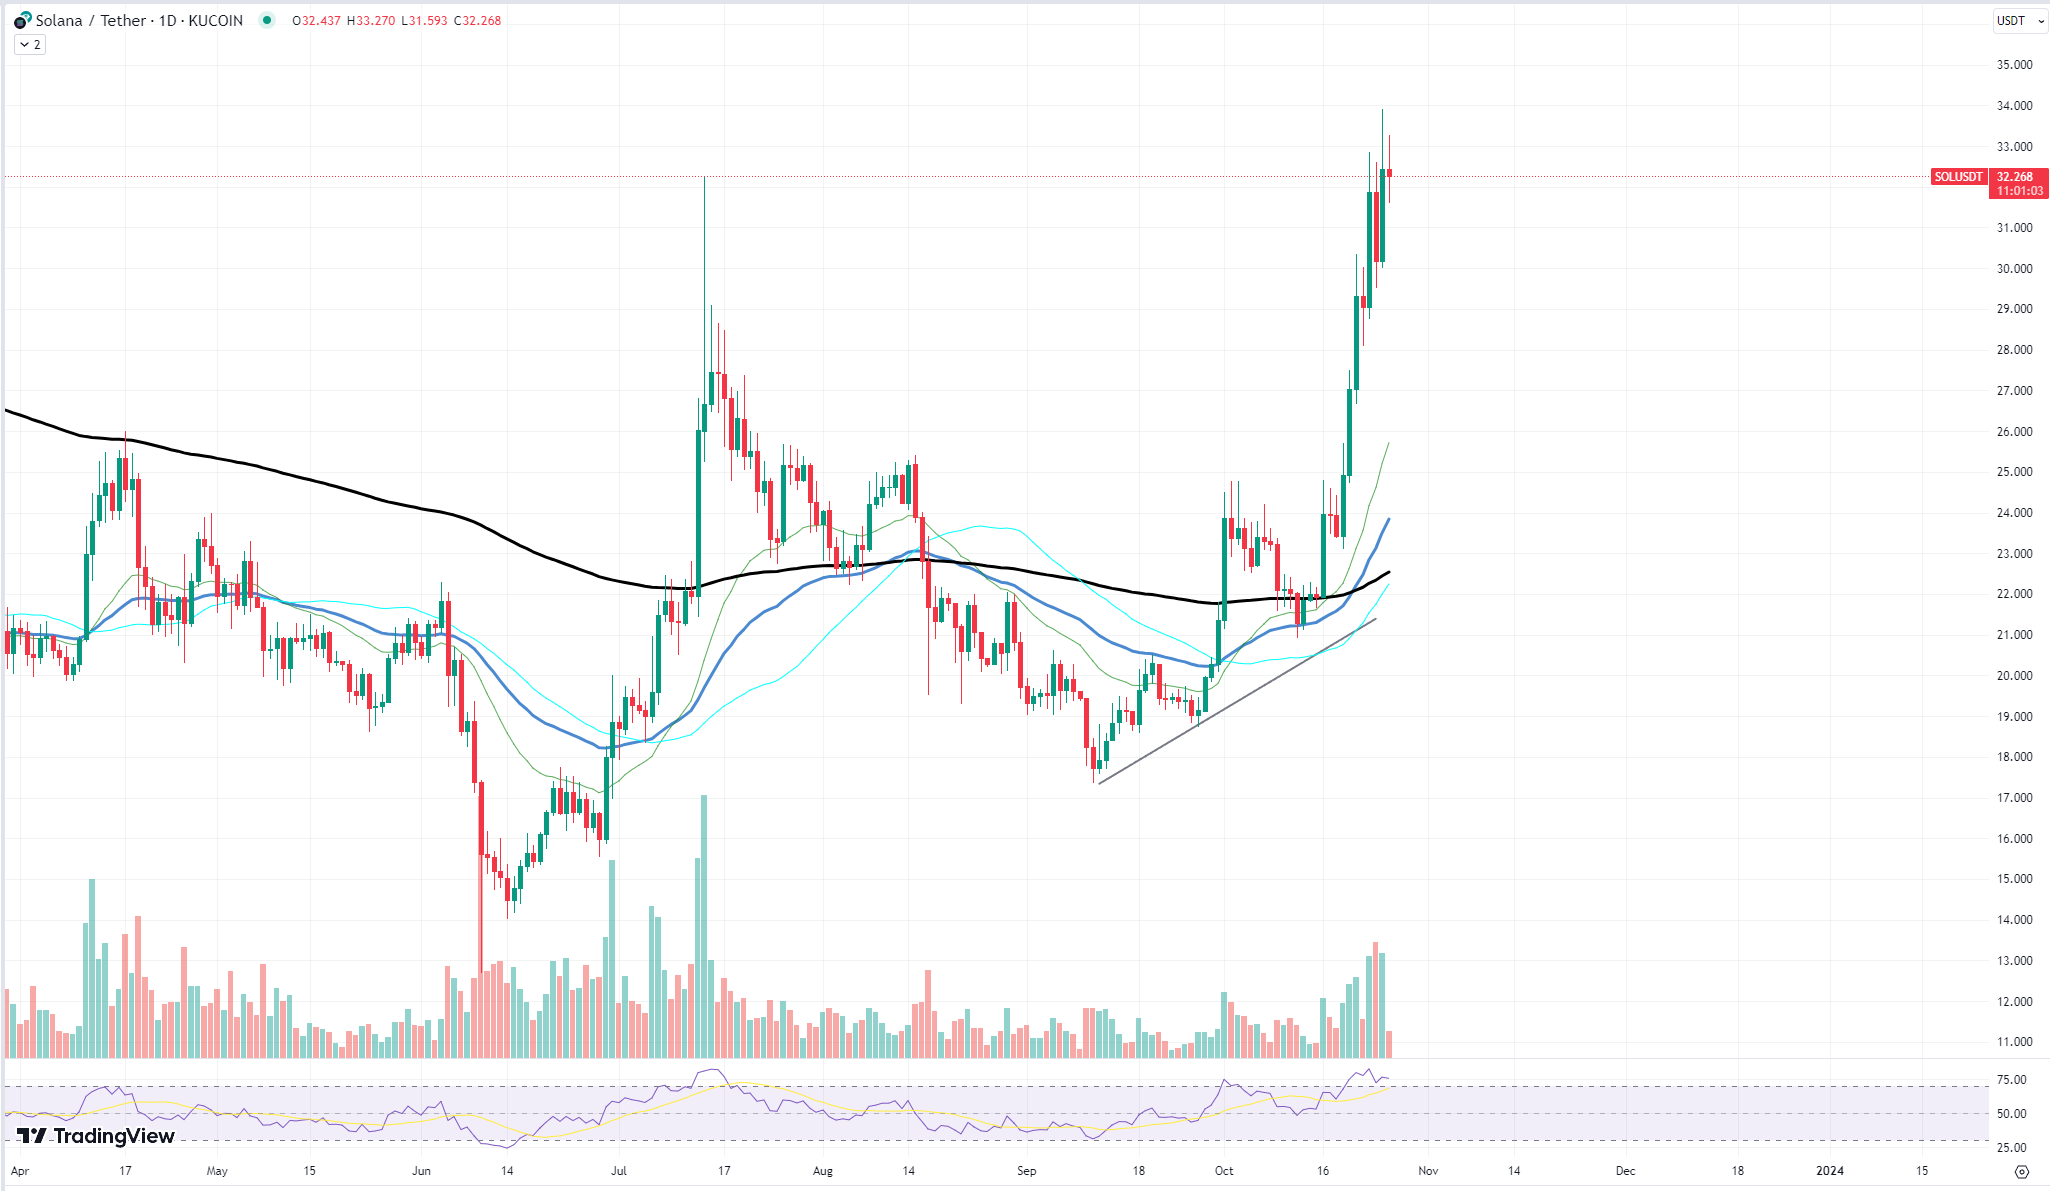
But every silver lining has a cloud. The impressive golden cross on Solana's chart, typically seen as a bullish sign, also brings with it a cautionary note. Historically, assets that have experienced such rapid ascents are also prone to corrections. While the golden cross and the 50% rally signify strong momentum, traders and investors would do well to exercise caution, anticipating potential pullbacks or consolidation phases.
XRP causes concerns
The XRP landscape appears to be a scene of caution, if not dismay, as the token struggles to find its footing in a sea of volatility. A thorough analysis of the XRP chart against Tether (USDT) on Binance suggests a worrisome trajectory for investors and traders alike.
Historically, XRP has had its moments of brilliance, but the recent dynamics paint a different picture. The token has been failing to gain any substantial upward momentum, and the attempts to break out from its downtrend have been feeble at best. While sporadic green candles have sparked hope among optimists, a closer look reveals the formation of a reversal pattern that might lead to further depreciation.
One of the most noteworthy observations is the appearance of the golden cross. In technical analysis, a golden cross – where a short-term moving average crosses above a long-term moving average – is often regarded as a bullish signal. However, for XRP, this event seems to have lost its significance. The token has been underperforming after the formation of this cross, indicating that not all textbook signals translate to real-world gains.
Further adding to the concerns is the lack of on-chain dynamics. A deep dive into on-chain analytics shows a glaring absence of significant whale activity. The big players, or the so-called "whales," are displaying a conspicuous lack of interest in XRP. Their absence from the scene not only indicates a lack of confidence in the asset's potential but also suggests that the token might not witness any massive buy-ins in the near future.
Ethereum's bright future
Ethereum (ETH), a pioneer in the field, is currently journeying toward the $2,000 mark. A close analysis of its price movement reveals interesting patterns and provides insights into what the future might hold for this digital giant.
From the chart, Ethereum has demonstrated recent bullish momentum, rebounding remarkably after facing a downtrend during the months of July to September. This momentum surge has certainly caught the attention of traders and analysts. However, as we approach the significant $2,000 mark, there exists a key resistance level that might challenge Ethereum's upward trajectory.

This resistance, situated just below the $2,000 price point, is expected to be a major hurdle. Historically, such key psychological price points often prove to be formidable barriers, and Ethereum is no exception. A break above this level would undoubtedly signal strong bullish momentum and could set the stage for further price appreciation. On the flip side, if ETH struggles to breach this resistance, we might see a retracement or even a consolidation phase.
Additionally, the volume bars depict increased interest and activity in Ethereum trading, especially in the most recent weeks. This heightened volume, coupled with consistent upward price movement, generally indicates strong investor confidence. However, any sudden drop in volume might signal a potential slowdown or correction in the near future.
 Dan Burgin
 U.Today Editorial Team