
Disclaimer: The opinions expressed by our writers are their own and do not represent the views of U.Today. The financial and market information provided on U.Today is intended for informational purposes only. U.Today is not liable for any financial losses incurred while trading cryptocurrencies. Conduct your own research by contacting financial experts before making any investment decisions. We believe that all content is accurate as of the date of publication, but certain offers mentioned may no longer be available.
A "golden cross" occurs when a short-term moving average, commonly the 50-day, crosses above the long-term moving average, usually the 200-day. Historically, in various asset classes, this crossover has been a precursor to potential extended bullish runs. But what's going to happen with Solana?
Solana's recent chart patterns have shown this very crossover. As if echoing the significance of this event, Solana's network activity has also seen a noticeable uptick. Increased network activity generally points toward higher adoption and can be a testament to a blockchain's growing relevance and utility in the real world.
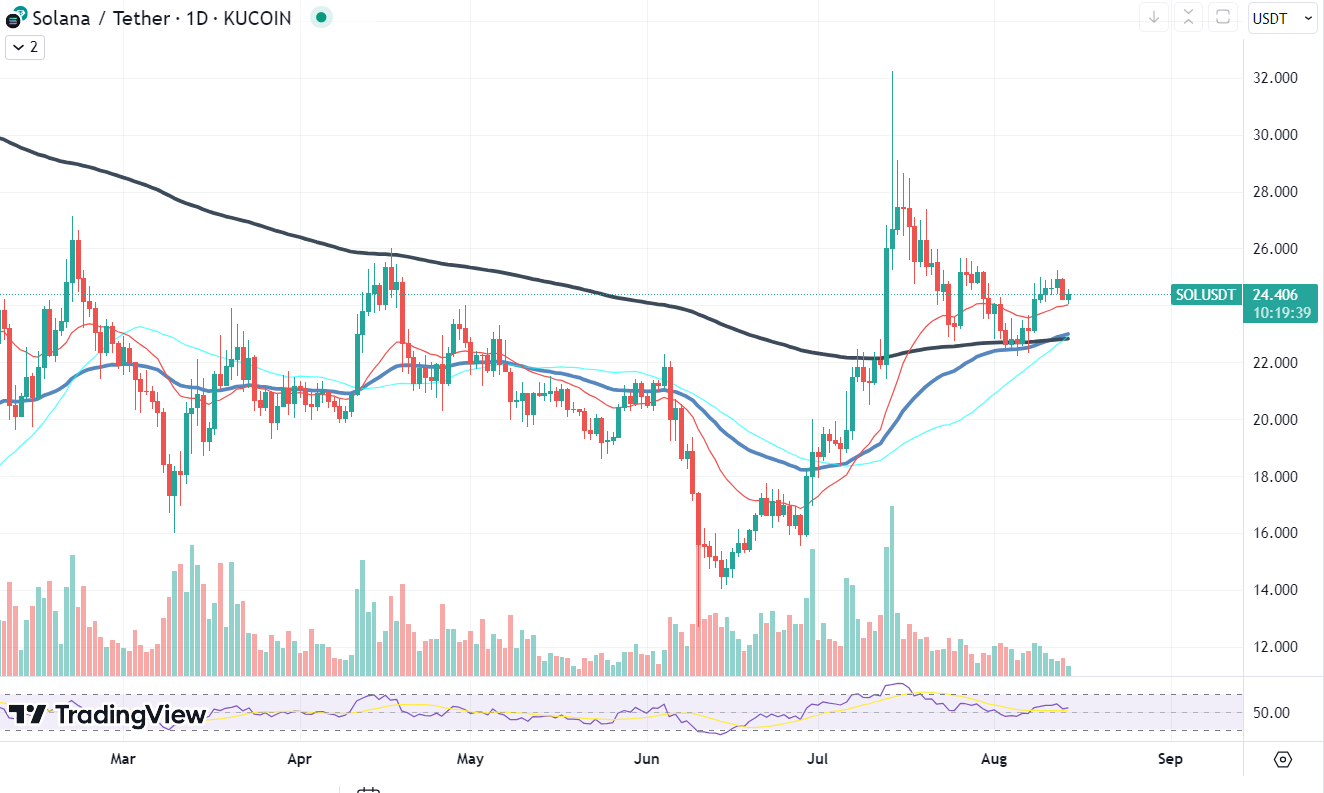
The price of SOL, currently hovering around the $24 mark, is also displaying bullish tendencies. With the Relative Strength Index (RSI) around 60, it suggests that while the asset is approaching overbought territory, there is still room for growth before any potential pullback.
However, it is crucial to note that while indicators like the "golden cross" provide insights based on historical data and patterns, the cryptocurrency market's volatile nature means nothing is set in stone. External factors, market sentiment and global events can always introduce variables that can affect predictions.
Shiba Inu's moving averages collide
Exponential Moving Averages (EMA) can sometimes provide valuable insights, especially when shorter term EMAs cross above or below longer term ones. Recently, Shiba Inu (SHIB) showcased a unique EMA cross that is sparking conversation within the crypto community.
The specific cross observed was the 21 EMA surging above the 200 EMA. While this is not a mainstream cross like the famous "golden cross" (50 EMA crossing the 200 EMA) or the "death cross" (the inverse), it does hold some weight.

The rise of a shorter term EMA above a much longer term one hints at potential short-term bullish momentum. In other words, it could be indicative of a short-term price reversal, especially when viewed in conjunction with other bullish signals.
That being said, it is important to note that this particular EMA cross is not foundational and is less widely regarded by traders. This is primarily because the 21 EMA is not as commonly used as other, more standard time frames, and its interpretation can vary. The 200 EMA, on the other hand, gives a broader view of price movements, and when a shorter EMA like the 21 moves above it, it might suggest that recent bullish activity could be stronger than the longer-term trend.
Ethereum is in holding pattern
Ethereum, the second largest cryptocurrency by market cap, has recently been painting an intriguing price pattern, leaving traders and investors speculating about its next move.
Historically, when trading volume diminishes, especially after a prolonged period of heightened activity, it is perceived as the calm before the storm, a precursor to a significant price move. In Ethereum's case, the dropping volume suggests that traders are adopting a wait-and-see approach which, more often than not, precedes a trend reversal. If this pattern holds true, ETH might just be gearing up for an upward price trajectory.
Parallel to the volume dynamics, there is another factor bolstering this thesis: the notable reduction in network activity. Ethereum's blockchain, which was once congested with transactions causing skyrocketing fees, has now seen a drop in on-chain operations. This reduction can be a double-edged sword. On the one hand, it may imply decreased usage or adoption, but on the brighter side, lower fees make the network more attractive, especially to developers.
For developers and enterprises that once found Ethereum's high gas fees a deterrent, this dip in fees can serve as an invitation to jump back into the fray. A more cost-efficient network can foster innovation, lead to the launch of new projects and increase overall activity. This potential influx can drive demand for ETH, as it is required for transaction fees and smart contract interactions, thereby putting upward pressure on its price.
 Dan Burgin