Disclaimer: The opinions expressed by our writers are their own and do not represent the views of U.Today. The financial and market information provided on U.Today is intended for informational purposes only. U.Today is not liable for any financial losses incurred while trading cryptocurrencies. Conduct your own research by contacting financial experts before making any investment decisions. We believe that all content is accurate as of the date of publication, but certain offers mentioned may no longer be available.
Shiba Inu is witnessing a substantial 150% surge in its burn rate, an event that remains a point of interest at the time of press. It is crucial to acknowledge that the burn rate percentage is inherently a dynamic value, subject to rapid and unpredictable changes, and the value you might see now will be different from the value an hour ago.
Despite this considerable increase in the burn rate, the price of SHIB appears to remain unaffected by this particular event. Specific data indicates that the burning of SHIB tokens has not translated into a significant price uptrend as one might anticipate.
The burn transactions have shown substantial activity, with millions of tokens being transferred to dead wallets in recent hours, yet the market response in terms of price action remains unenthusiastic.
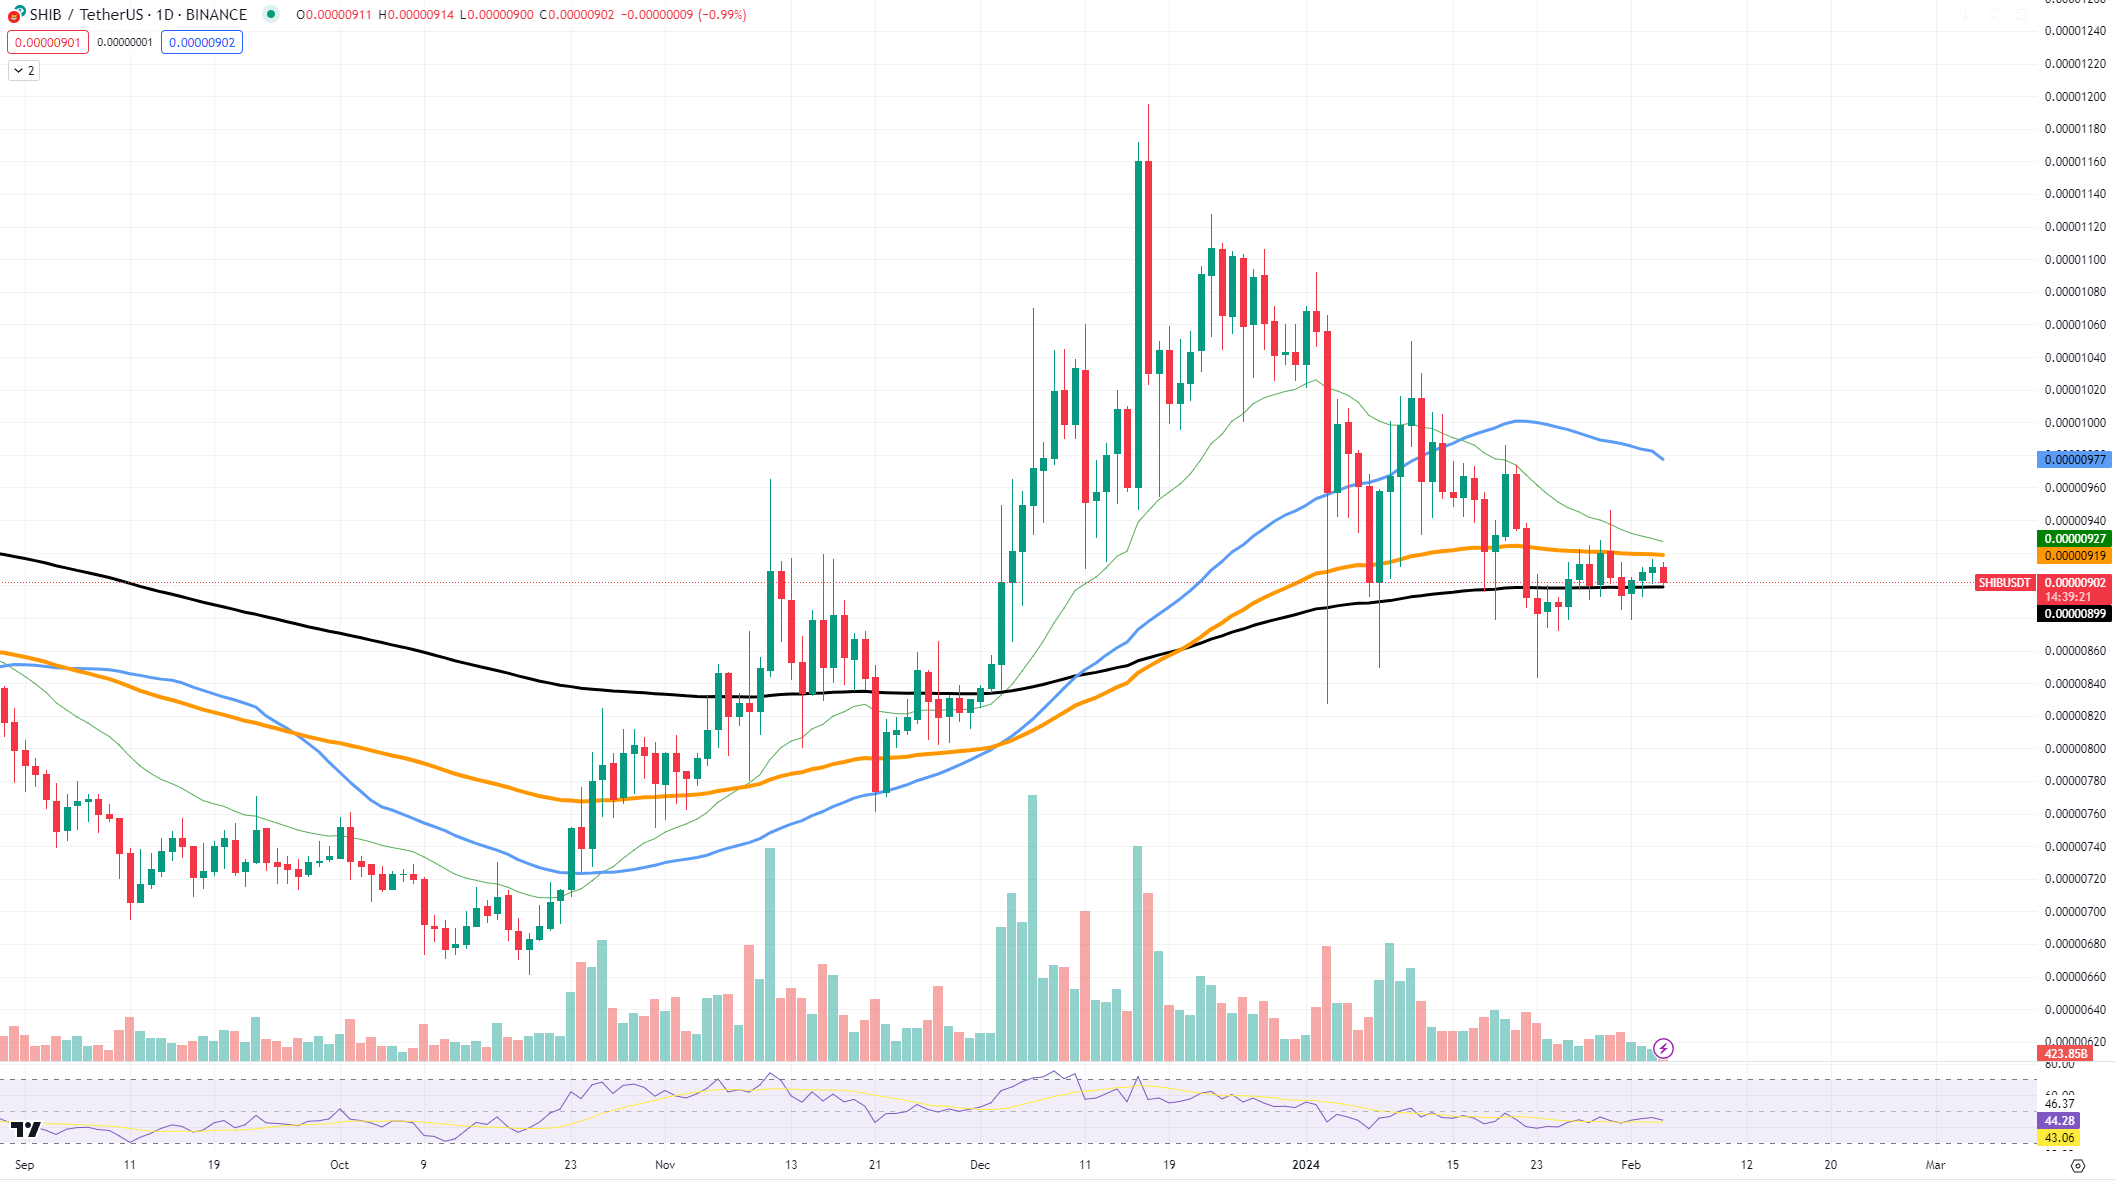
As the SHIB price chart shows, we observe key resistance and support levels that are critical to understanding the current market behavior. The local resistance level can be identified at approximately $0.00000971, which the price has tested but not conclusively broken through. On the flip side, the token has found support at around the $0.00000899 mark, a level that has provided a degree of price stability during recent trading sessions.
A closer examination of the chart indicators provides additional data. The 50-day moving average and the 200-day MA, shown as the black line, are pivotal in analyzing the trend. At present, the price hovers between these two MAs, suggesting a consolidation phase without a clear directional trend.
Moreover, the RSI, hovering around the 44.46 mark, indicates that SHIB is neither overbought nor oversold, offering no immediate signals for a price breakout or breakdown.
 Dan Burgin
 U.Today Editorial Team