Disclaimer: The opinions expressed by our writers are their own and do not represent the views of U.Today. The financial and market information provided on U.Today is intended for informational purposes only. U.Today is not liable for any financial losses incurred while trading cryptocurrencies. Conduct your own research by contacting financial experts before making any investment decisions. We believe that all content is accurate as of the date of publication, but certain offers mentioned may no longer be available.
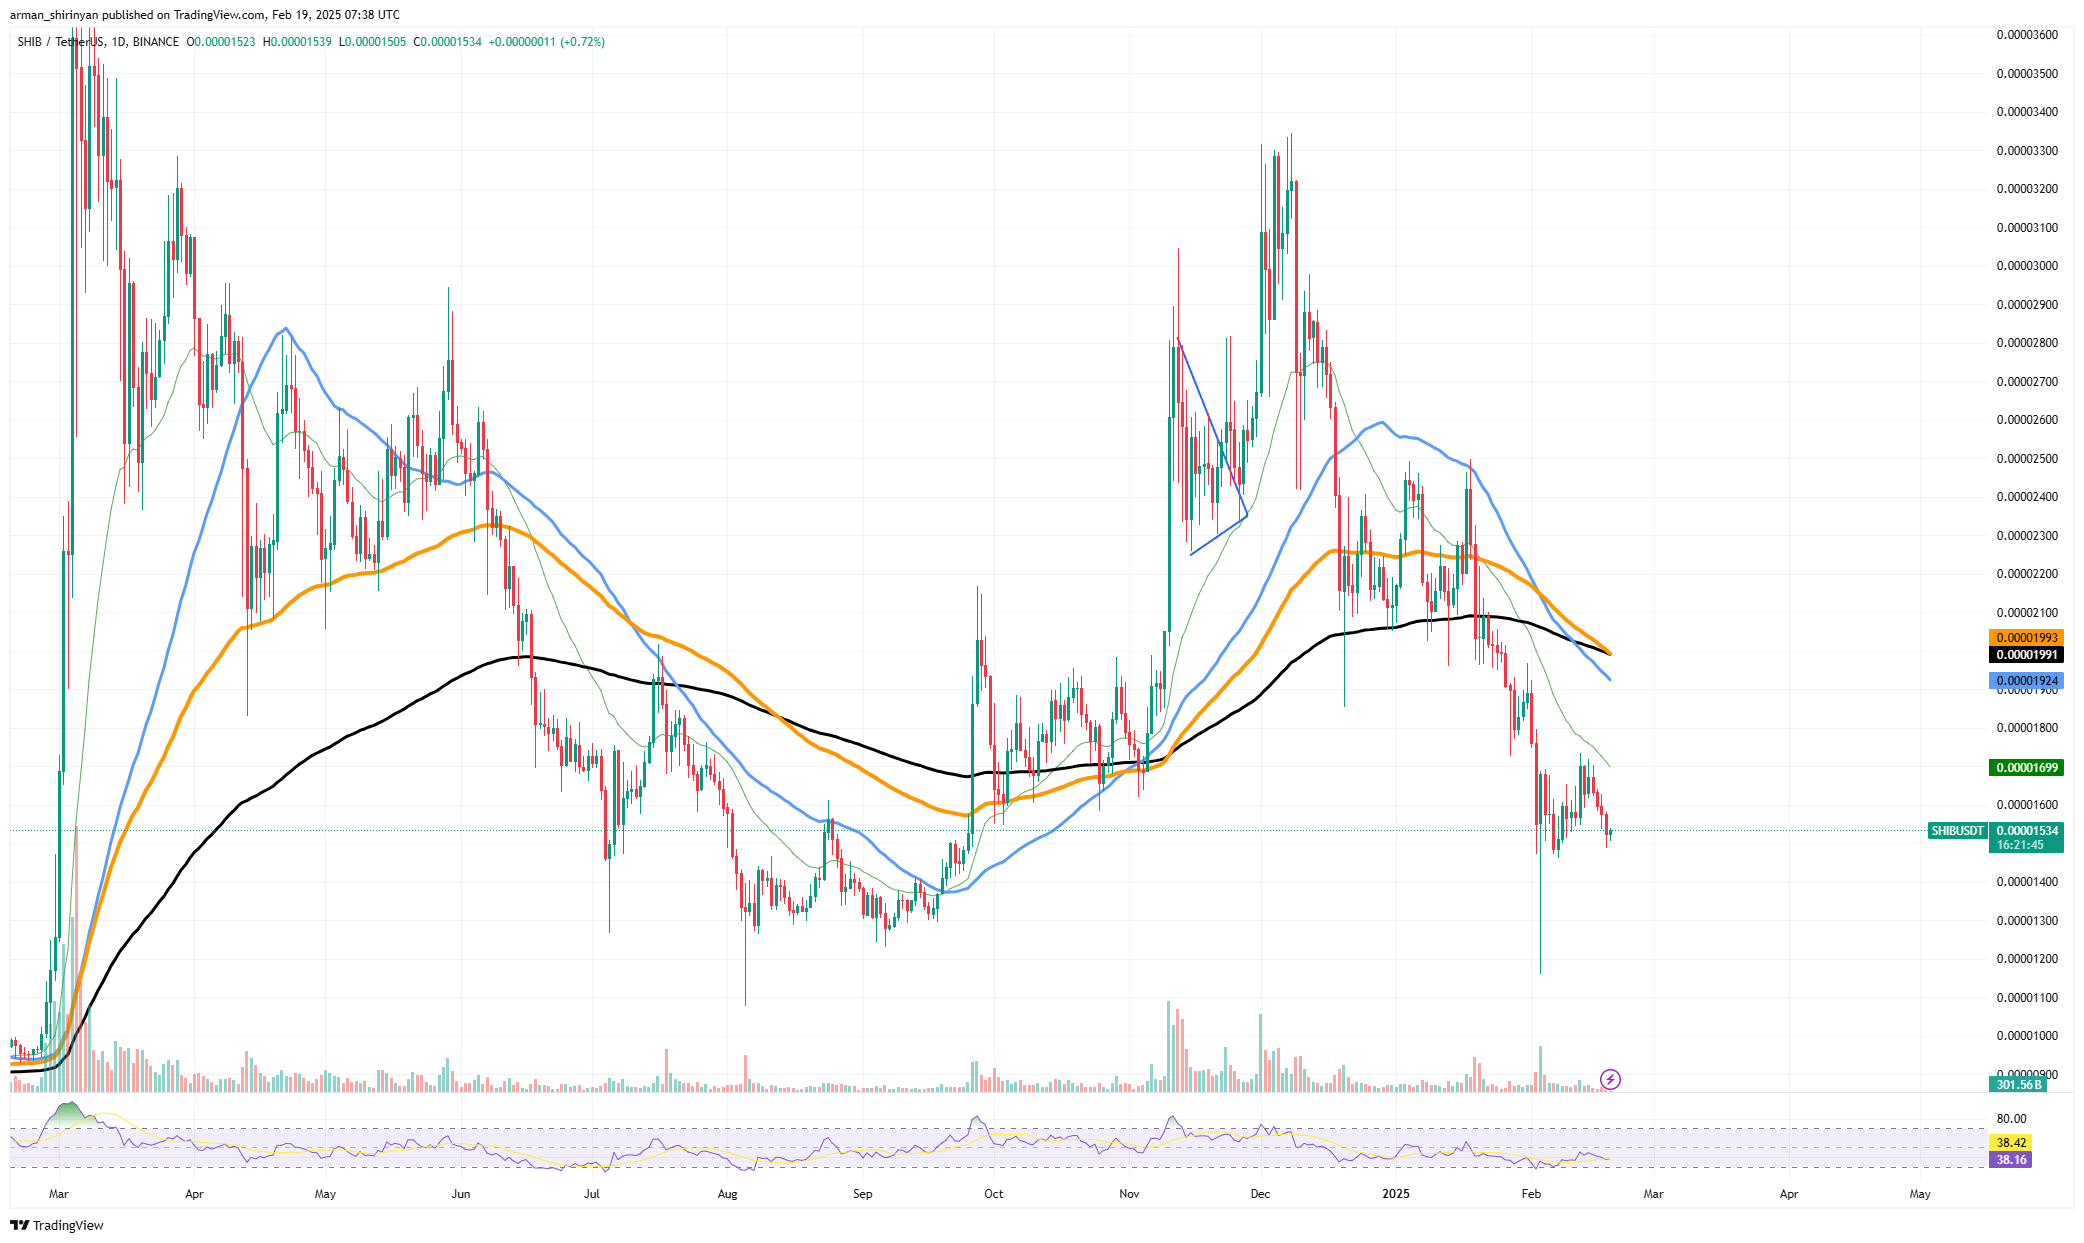
Shiba Inu has finally reached a level that might become a foundation for a proper price reversal. Following the death cross, the price action suggests that SHIB could be around the bottom. The double bottom pattern is quite often regarded as a trend reversal level, but there is still a need to look back at the rest of the market.
SHIB has been on a downward trading trajectory and has had difficulty regaining momentum following a protracted sell-off. A double bottom that formed close to the $0.00001485 level, however, indicates that the meme token might be stabilizing. When buyers start to intervene and stop further declines, this pattern usually signals a possible support level. The death cross is one of the most important technical indicators to keep an eye on; it recently showed up on SHIB's chart.

When the short-term moving average crosses below the long-term moving average, it indicates bearish momentum. In the past, this configuration has frequently resulted in additional drops, but occasionally it has served as a starting point prior to a significant reversal. In order to validate a bullish reversal, SHIB must break above significant resistance levels, beginning with the 50-day moving average close to $0.00001700.
If this level is maintained, a recovery toward $0.00002000 may be possible. The asset may not be able to stage a significant recovery, though, as upside volume is still weak. SHIB may continue to drop toward $0.00001300 or lower if selling pressure continues and it is unable to hold the $0.00001485 support.
SHIB's capacity to maintain a recovery is still in doubt, though, due to the absence of potent bullish catalysts on the market. SHIB has achieved significant technical support, but the direction of the market as a whole and the resurgence of buyer interest will determine much of its future course. Staying vigilant might be the key here as the rest of the market is yet to shown its true direction.

 Alex Dovbnya
 Denys Serhiichuk
 Gamza Khanzadaev
 Tomiwabold Olajide
 Caroline Amosun