
Disclaimer: The opinions expressed by our writers are their own and do not represent the views of U.Today. The financial and market information provided on U.Today is intended for informational purposes only. U.Today is not liable for any financial losses incurred while trading cryptocurrencies. Conduct your own research by contacting financial experts before making any investment decisions. We believe that all content is accurate as of the date of publication, but certain offers mentioned may no longer be available.
A glance at the daily chart of Shiba Inu showcases an astounding surge in trading volume, especially around its current price level. This significant uptick in volume is raising eyebrows and leading many to wonder: what is driving this sudden interest?
First, it is crucial to understand the role of trading volume in the crypto markets. High trading volume generally suggests heightened interest in a particular asset, which can be due to various factors, such as news, market sentiment or external events. A sharp increase in volume, as observed with SHIB, often indicates strong buying and selling activity and can be a precursor to significant price movements, whether bullish or bearish.
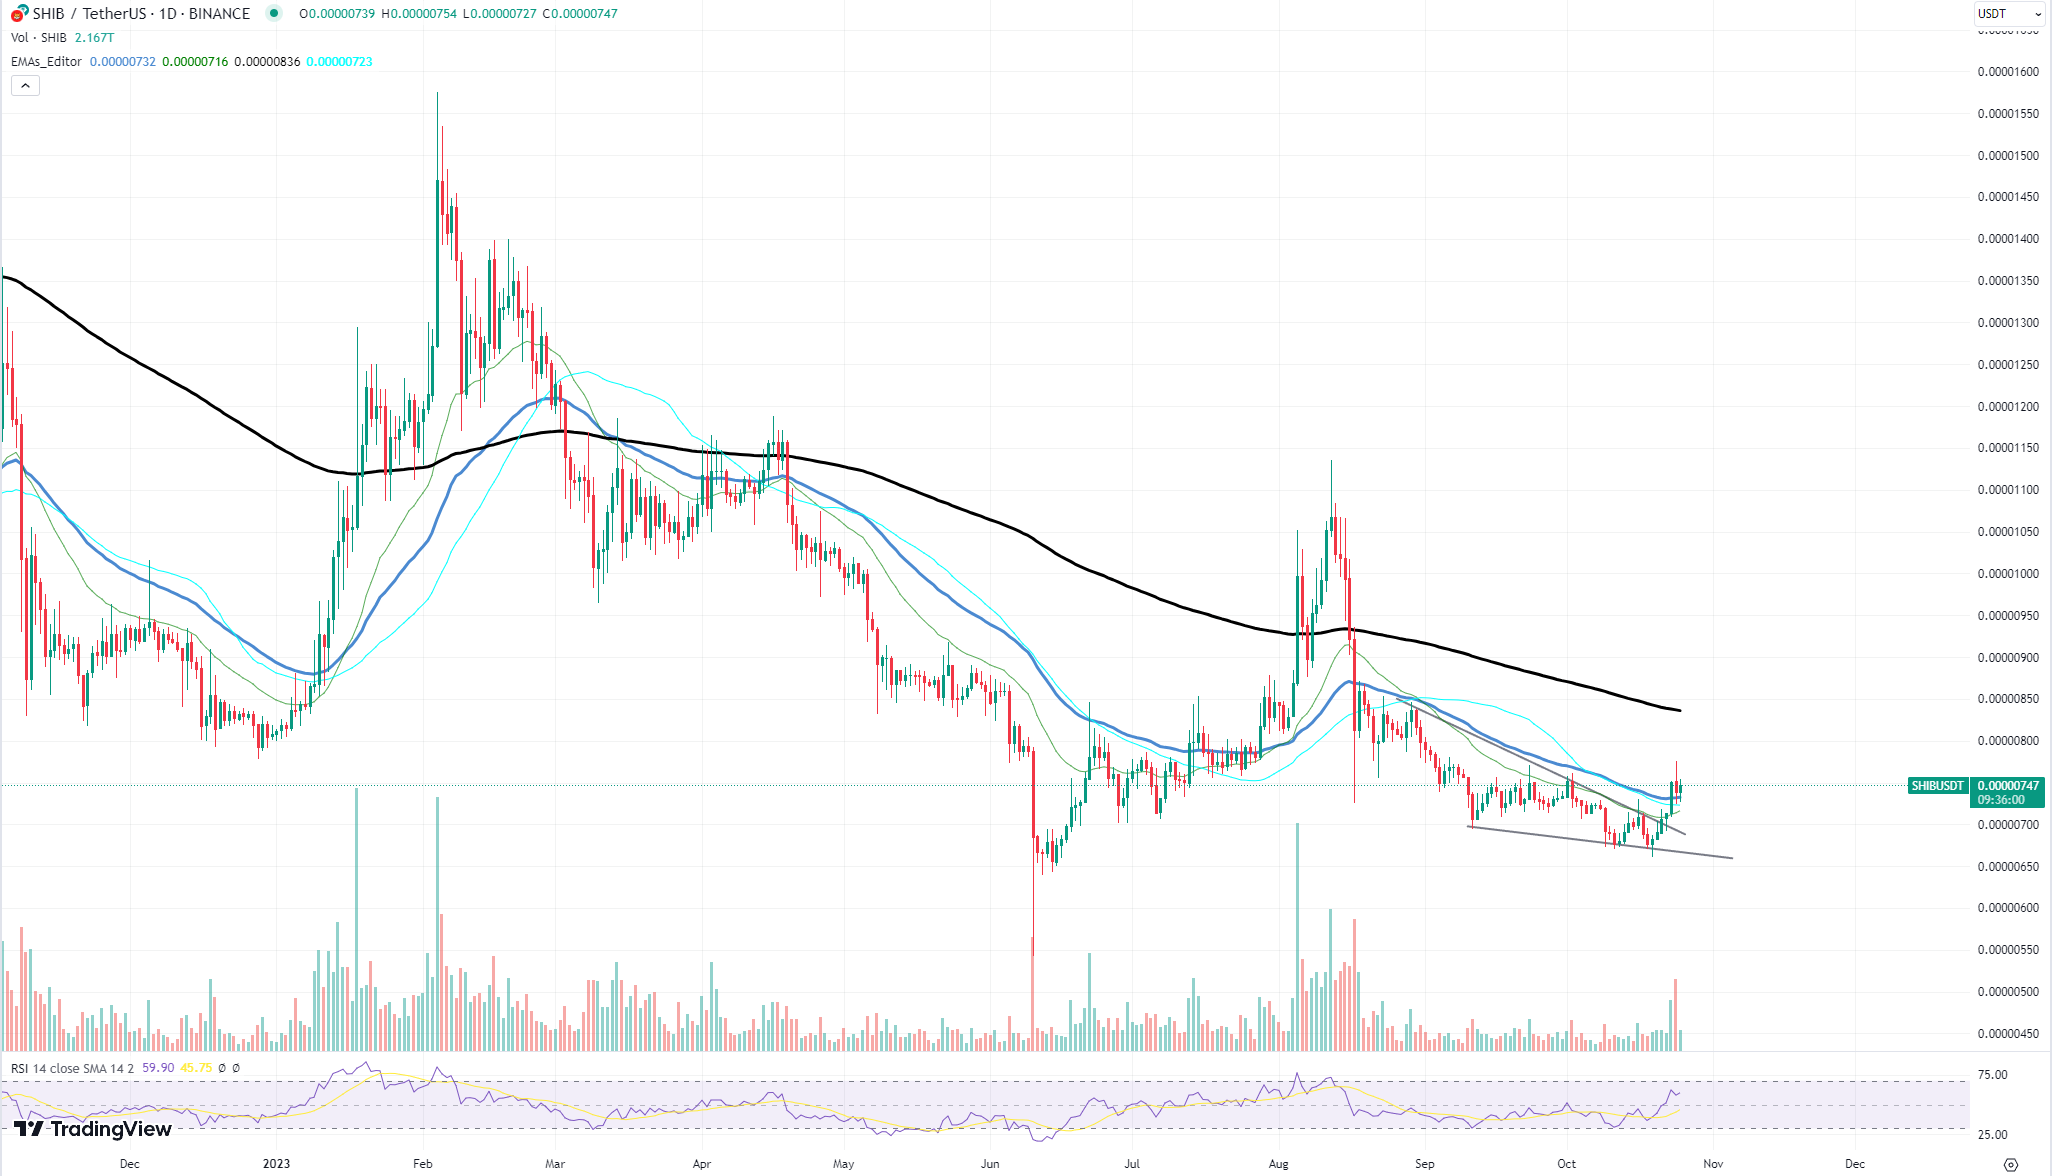
When analyzing SHIB's chart, the pronounced volume bars stand out prominently. This enormous volume surge suggests that traders and investors have become keenly interested in the token in its current price range. Such activity often reflects a tug-of-war between bulls and bears, with the asset being heavily traded.
One of the potential reasons behind this drastic surge in volume can be attributed to an overall surge on the broader cryptocurrency market. As the crypto space garners more attention and attracts new participants, many tokens, including popular meme coins like SHIB, naturally experience an influx of traders.
Cardano needs one more push
Cardano's recent price action has caught the attention of many crypto enthusiasts and traders. After exhibiting signs of a potential prolonged bull run, the ADA market met unexpected and swift resistance, leading to questions about what went wrong.
200 EMA resistance: One of the most pronounced observations is the interaction of Cardano's price with the 200 Exponential Moving Average (EMA). As the price approached this crucial resistance level, it reversed swiftly. The 200 EMA often acts as a strong barrier, especially in the crypto market. The fact that ADA could not maintain its momentum above this level raised eyebrows and led to a wave of uncertainty among traders.

Selling volume surge: Accompanying the price reversal was a significant surge in selling volume. The towering red volume bars, after touching the 200 EMA, clearly indicate that there was strong selling pressure at this level. This could be attributed to traders taking profits, fearing resistance at the 200 EMA or a culmination of other external factors that influenced selling sentiment.
Several factors might have contributed to ADA's sudden fall after touching the 200 EMA. Firstly, the crypto market is inherently volatile, and swift reversals after touching significant resistance levels are not uncommon. Additionally, news or events related to the Cardano project, macroeconomic factors or broader market sentiment can play a role.
Ethereum needs break
The recent price action of Ethereum (ETH) suggests that its rally could be losing steam. Based on the attached chart, there are several indicators and patterns that are worth paying attention to:
Moving averages: The blue and black moving averages show a convergence, which typically suggests a potential change in trend direction. Ethereum's price recently crossed above both moving averages, hinting at a potential bullish shift. However, the recent red candles indicate a pullback, possibly driven by profit-taking or heightened selling pressure.
Support and resistance levels: Based on the chart, there is a strong resistance level near the $1,780 mark, as evidenced by the most recent candle wick touching and retracting from this point. If this resistance is broken convincingly, Ethereum might test higher price levels. Conversely, the immediate support seems to be around the $1,600-$1,620 area, where the previous consolidation was noted.
While short-term movements are challenging to predict with precision, Ethereum's recent price action suggests caution. The resistance at $1,780 must be watched closely. A convincing break above this could see further upside, but failure to break might lead to the price testing the lower support levels again.
 Dan Burgin
 U.Today Editorial Team