Ripple (XRP) has a tough 1-year performance declining -73.75% from over $1 to a price of $0.2903 as of Jan. 30, 2019. Year-to-date performance is negative also, -21.02%. Our Ripple price prediction article for February 2019 will mention some of the monthly forecasts by other websites and will present our unbiased Ripple price prediction based on technical analysis.
Some key stats as of Jan. 30, 2019 for Ripple coin are the following:
- Market Cap: $11.952.632.279 USD, 3.457.553 BTC
- Volume (24h): $414.712.805 USD, 119.965 BTC
- Rank 2 on top 100 cryptocurrencies by market capitalization
- 52 Week Low - 52 Week High: $0.2478- $1.2681
Ripple price prediction February 2019 by some sources
- LongForecast estimates an open price of $0.28, a low-high range of $0.20-$0.29 and a close price of $0.23. This means a monthly return of -17.9% and an average price of $0.25. A pessimistic of bearish Ripple price forecast in general.
- PrevisioniBitcoin does not provide a specific price for Ripple for February 2019. Still it has a bullish Ripple price prediction mentioning that Ripple may boost its price, mainly because of a mass adoption of this cryptocurrency in the next months. Ripple is expected to rise with a strong capitalization and consequently a concrete value per coin increase.
- CryptoTreat appears to be very optimistic about Ripple. Its Ripple predictions for February 2019 are an open price of $2.086852, a close price of $2.136092, a minimum price of $2.076072 and a maximum price of $2.152812. In total it is a very bullish Ripple price prediction and the open price seems at least unrealistic with only two days for January 2019 to end and a recent price of about $0.29.
- TokenMantra mentions that some estimates are for a declining price of Ripple (XRP) up to $0.232 by the end of February, a pessimistic Ripple price prediction.
In general, the sources mentioned above are mixed about reporting some Ripple price prediction targets for February 2019. What is pour outlook based on our technical analysis?
Ripple price prediction February 2019 – Technical analysis scenarios
A mention to our yearly Ripple price prediction for 2019 first. A short-term analysis based on the daily and weekly charts of Ripple follows:


Ripple price prediction optimistic scenario
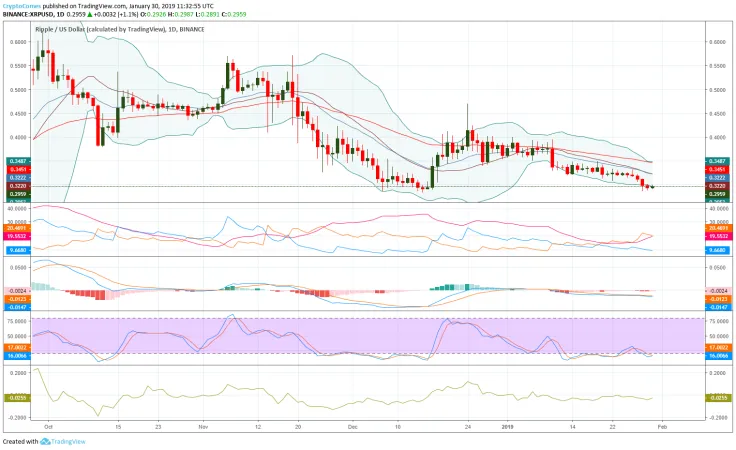
As the current price of Ripple coin has reached the lower daily Bollinger band at $0.2944 a bounce is likely up to the upper daily Bollinger band at $0.3487. A further increase to the level of $0.579, the upper weekly Bollinger band has low chances to be materialized.
The level of $0.2933 acts as a strong support, and there is a small positive divergence formed related to the Stochastics indicator (14,3,3). From the low price of $0.32 to $0.2860, the value of Stochastics indicator has moved a bit higher. These higher lows may indicate a short-term reversal to Ripple’s coin price soon. Momentum indicator is almost flat, and this may pause the current downtrend.
Ripple price prediction pessimistic scenario
A motto in trading which does not work always is do not fight the trend. Declining 20-day and 50-day exponential moving averages with current values at $0.3216 and $0.3498 respectively, indicate a downtrend, which is losing though its momentum.
The ADX/DMI indicator shows that -DI line is above +DI line with values of 20.47 and 9.66 respectively, showing that the most dominant trend for now is a downtrend. The MACD indicator is pointing down, having a negative value, and the coin after a consolidation phase moved lower.
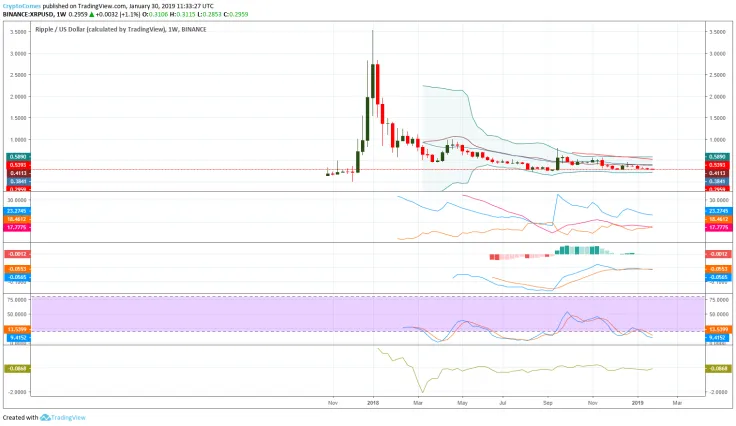
The consolidation range of $0.31-$0.35 had a time period of about fourteen days. Usually, but by no means not always, after a breakout of a consolidation phase, a continuation of the most current trend resumes. If the support near the level of $0.29 does not hold, a forecast would be for the price to move lower.
The question is how much lower though. Two potential target zones are the levels of $0.2750 and $0.2415. These levels are derived from the weekly chart. The level of $0.2415 is the lower weekly Bollinger band.
As a conclusion and mentioning that this article is strictly educational, not an investment recommendation, we favor the pessimistic scenario for Ripple, that is a continuation of a downward trend in February 2019. Conditions may change, but for now odds suggest potential lower price levels.

 Dan Burgin
 Alex Dovbnya
 Denys Serhiichuk
 Caroline Amosun