According to Bitinfocharts, more than $1.1 billion worth of LTC was transacted over the Litecoin network on Nov. 30, but the volume started to climb even before that (almost $600 million worth of LTC transacted on Nov. 29).
Considering that the average daily volume for Litecoin is much lower, we can safely assume we are dealing with a whale or group of whales moving their assets. And if we were to speculate, we could say that an entity like the Bakkt exchange is preparing for their early 2019 launch.
Chart Analysis – LTC/USD

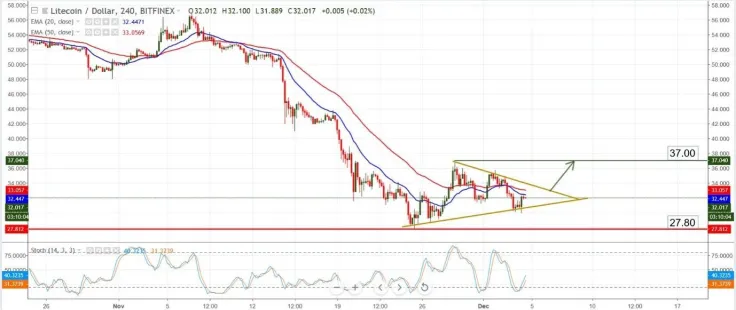
Litecoin gave up the gains made a few days ago and dropped after reaching a high at 37 against the US dollar, disappointing most of its fans who were expecting a stronger recovery towards $40.
Currently, the pair has established support on the bullish trend line seen on the chart above and is trading around 32, but below the 2 Exponential Moving Averages, which are still crossed bearish (i.e. 50 EMA-red is above 20 EMA-blue).
The pair has printed a higher low, which is a bullish sign but also a lower high, which is a bearish sign and all these paints a blurry picture, like most other cryptocurrencies, which are showing the same behaviour. A breakout above or below the triangle formation seen on the chart will most likely trigger an extended move.
Support zone: bullish trend line followed by 27 – 28 area
Resistance zone: bearish trend line
Most likely scenario: move outside the triangle; we slightly favour the long side because the downtrend is overextended
Alternate scenario: tight range, move outside triangle without momentum or clear direction
 Denys Serhiichuk
 Alex Dovbnya
 Gamza Khanzadaev
 Tomiwabold Olajide