Disclaimer: The opinions expressed by our writers are their own and do not represent the views of U.Today. The financial and market information provided on U.Today is intended for informational purposes only. U.Today is not liable for any financial losses incurred while trading cryptocurrencies. Conduct your own research by contacting financial experts before making any investment decisions. We believe that all content is accurate as of the date of publication, but certain offers mentioned may no longer be available.
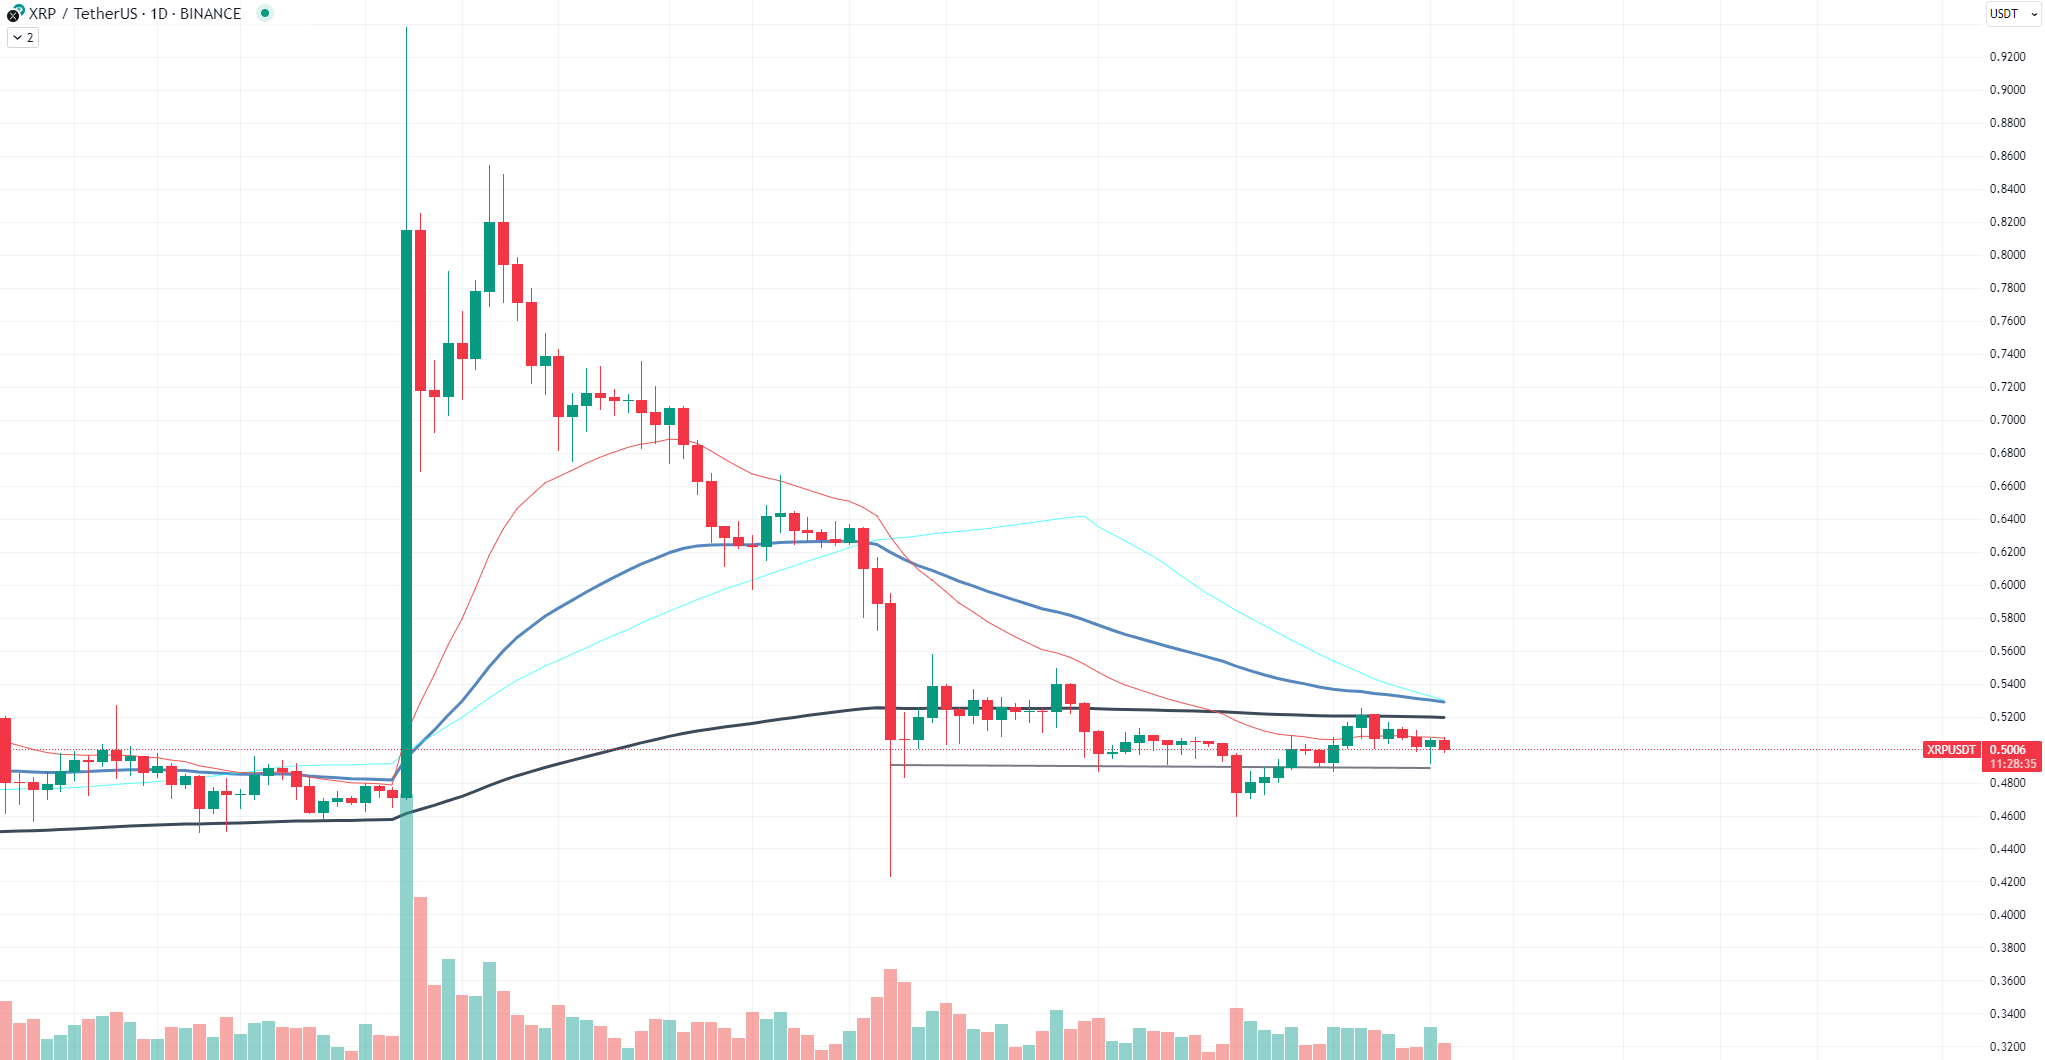
The XRP landscape has been anything but vibrant lately. The asset's price has been meandering in a sideways trend, a far cry from the bullish sentiment many investors were hoping for. Currently priced at approximately $0.50, XRP has seen its value erode from a local high of $0.52.
The most recent market data analysis reveals that XRP's price has been languishing, reinforcing the notion that the asset might be on the brink of another "death cross." For the uninitiated, a death cross occurs when a short-term 50-day moving average crosses below a long-term moving average like 200 EMA, typically signaling a bearish trend.
The lackluster price action of XRP does not inspire much confidence. The asset has been struggling to maintain its footing, and the market seems to be preparing for another downturn. The sideways movement, coupled with declining prices, suggests that XRP could be in for a rough ride.
So, what's the thesis here? Given the current market conditions and the uninspiring performance of XRP, it is plausible to anticipate another death cross in the near future. This could further dampen investor sentiment and push the asset into a more profound slump. Traders and investors should keep a close eye on the moving averages and other technical indicators to gauge the asset's next move.
In a market that thrives on volatility and speculation, XRP's current state is a cautionary tale. While it is too early to ring the death knell, the signs are ominous. The asset needs a significant catalyst to break free from this inertia, failing which it could continue its descent into obscurity.
Cardano's triangle is breaking
Cardano's price action has been a subject of intense scrutiny lately, especially as it nears the apex of a descending triangle. This geometric price pattern is often seen as a bearish indicator, but I i's not as straightforward as it seems. Descending triangles can lead to a volatility implosion, setting the stage for a significant price movement in either direction.
Data from the SIC plugin reveals that Cardano's price has been oscillating within this descending triangle, making it a focal point for traders and analysts alike. The asset is currently priced at approximately $2.15, and the lower trendline of the triangle sits at around $2.10. The narrowing price range indicates that Cardano is gearing up for a decisive move.

What's the thesis here? Descending triangles often act as a coiling spring, storing energy for a substantial price move. While they are generally bearish, the outcome is not set in stone. The key lies in the breakout direction. A move above the upper trendline could signal a bullish reversal, while a dip below the lower trendline might confirm bearish sentiment.
Given the current market dynamics and Cardano's recent performance, it is plausible that we are on the cusp of a significant price event. Traders should keep an eye on volume as well, as an increase in trading activity could provide the catalyst for a breakout.
PEPE staying alive
Known for its typical meme coin price movements, PEPE has often left investors bewildered. But recent data suggests a shift in the narrative. PEPE is showing signs of a long-term trend reversal, and it is worth taking a closer look.
The token's price action has been flirting with the 21 Exponential Moving Average (EMA), almost breaking through it. For those unacquainted with technical jargon, the 21 EMA serves as a crucial indicator for traders. A breakthrough often signals a bullish trend, and PEPE is teetering on the edge of such a move.

Adding to the intrigue is the Relative Strength Index (RSI), a momentum oscillator that measures the speed and change of price movements. The RSI for PEPE has surged from a meager 25 to a more robust 44. While not in the "overbought" territory, this jump is significant. It indicates a shift in momentum, possibly pointing to an upcoming bullish phase for PEPE.
However, it is essential to approach these indicators with caution. PEPE's history of "pump and dump" schemes cannot be ignored. Investors have been lured by short-term gains, only to be left holding the bag when the price plummeted. So, while the current indicators are promising, they are not a guarantee of sustained growth.
 Dan Burgin
 U.Today Editorial Team