
Disclaimer: The opinions expressed by our writers are their own and do not represent the views of U.Today. The financial and market information provided on U.Today is intended for informational purposes only. U.Today is not liable for any financial losses incurred while trading cryptocurrencies. Conduct your own research by contacting financial experts before making any investment decisions. We believe that all content is accurate as of the date of publication, but certain offers mentioned may no longer be available.
Dogecoin is showing a gleam of technical optimism. The recent crossing of the 100-day and 50-day EMAs is a small version of the much celebrated 50-200 EMA golden cross, often regarded as one of the most bullish signals in technical analysis.
This mini golden cross, while not as definitive as the classic version, still gives traders a reason to pay attention. Historically, such crosses have been precursors to potential uptrends. For Dogecoin, the price has been oscillating around this crossover region, suggesting a tug-of-war between bears and bulls.
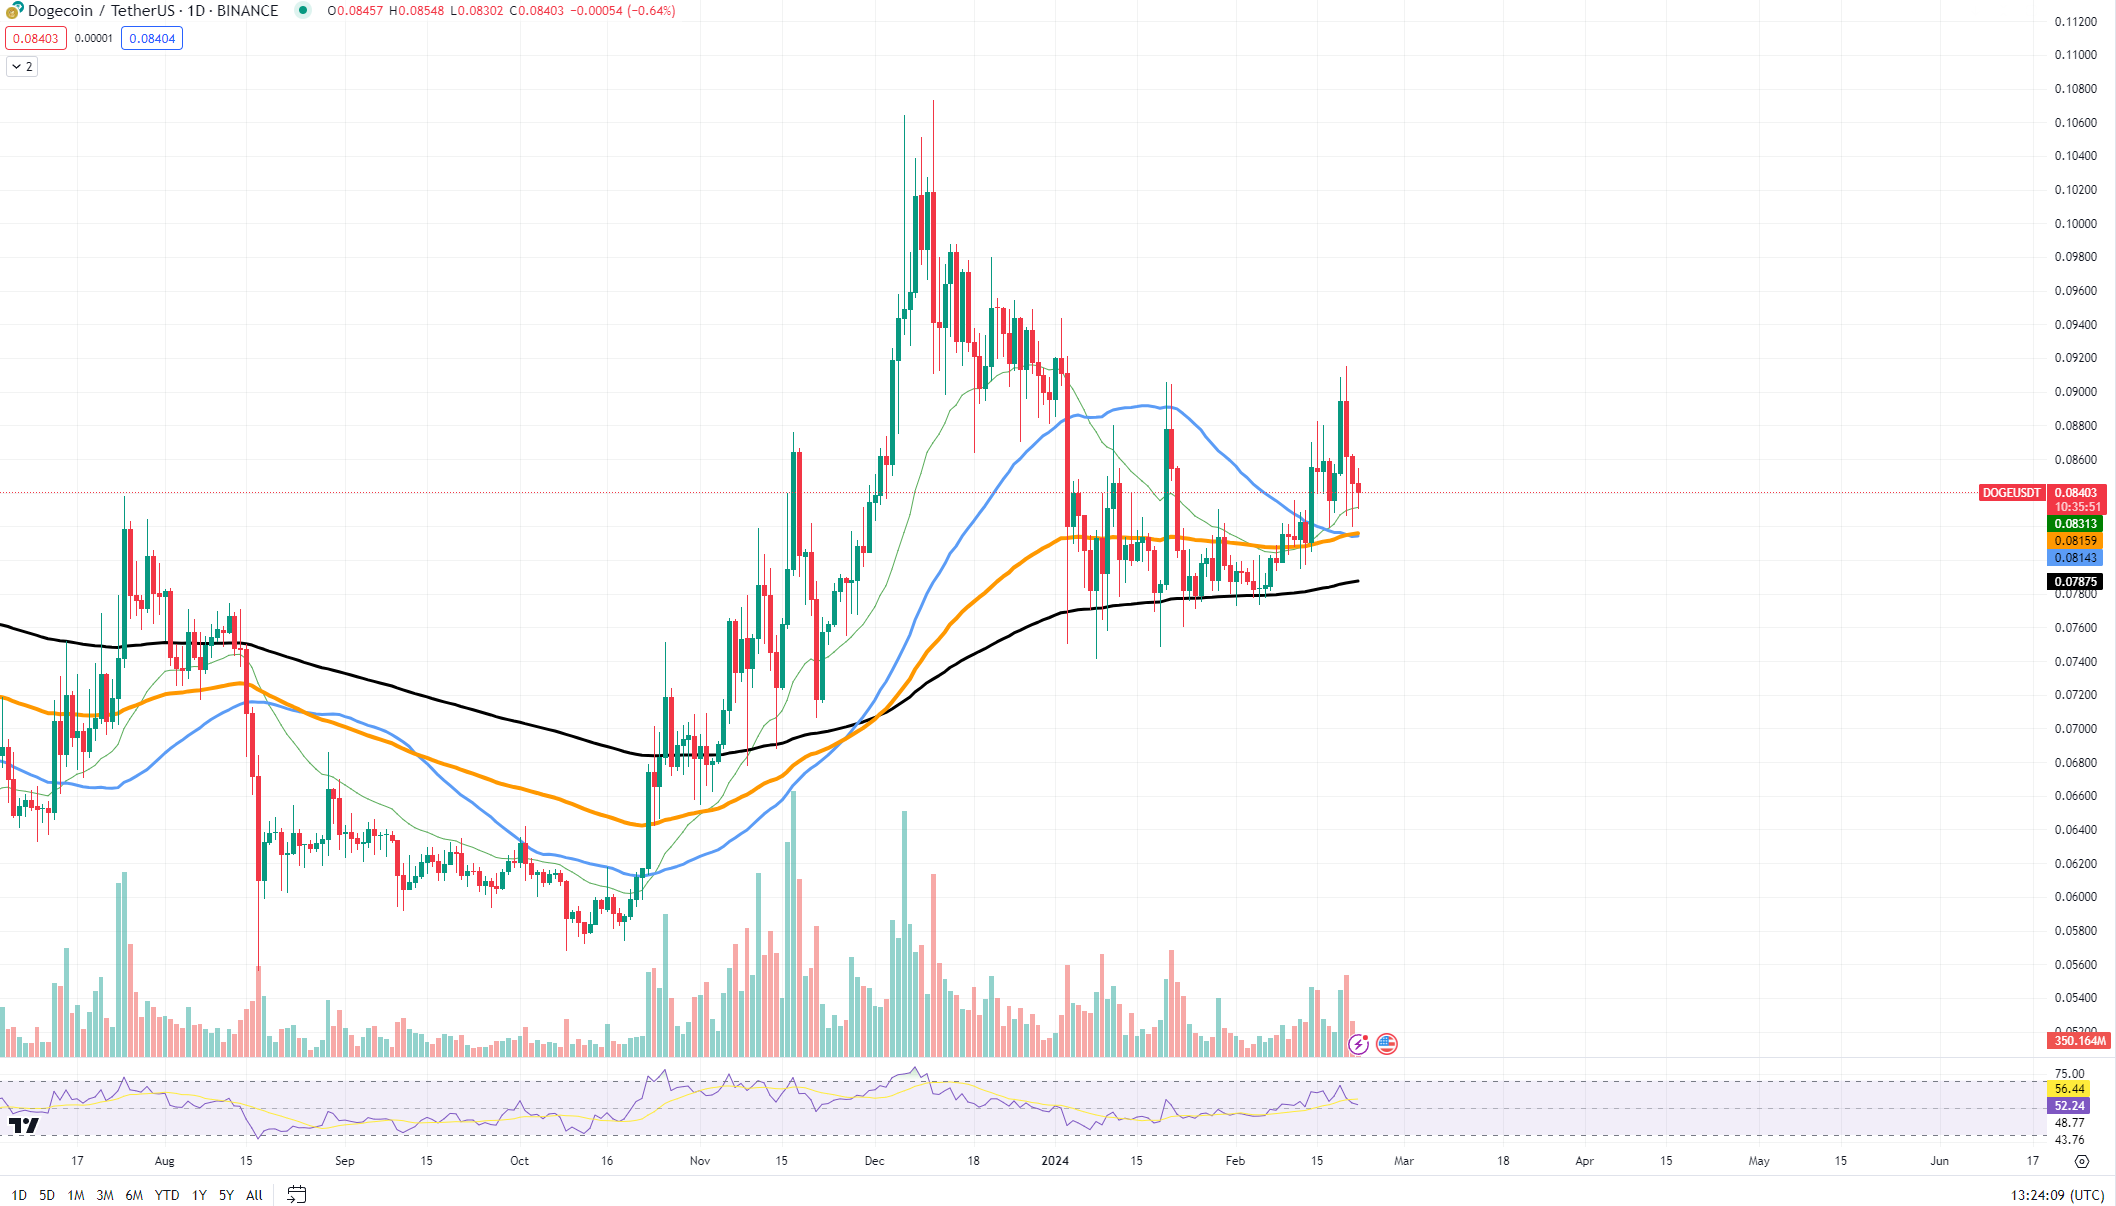
Dogecoin's current support level can be spotted around the $0.077 mark, which aligns with the 100-day EMA. Should this level hold, it could act as a springboard, reinforcing the bullish sentiment brought about by the EMA crossover. On the flip side, if this support falters, we might see a dip toward the $0.070 threshold, where previous market activities have shown interest.
If Dogecoin can capitalize on this mini golden cross, the next target would be to test the resistance at $0.088. A break above this level with sustained volume could set the stage for a continued upward trajectory, with the $0.10 psychological barrier as the next significant milestone.
Ethereum finally scores
Ethereum has achieved a significant milestone by breaking through the $3,000 price barrier, a bullish signal that many investors have anticipated for the last few months.
The ascent to $3,000 marks a key psychological and technical level for Ethereum. This breakthrough is supported by a robust volume profile, suggesting that the move is backed by substantial market interest.

Local support levels now adjust to this new paradigm, with previous resistance around $2,800 potentially becoming a new support zone. Should ETH maintain its position above this level, it would confirm the strength of the current trend and possibly establish a foundation for further gains.
Looking at the potential for a rally continuation from the current levels, the momentum appears strong. Investors and traders will now be eyeing the next resistance levels, which could be around the $3,200 to $3,300 range, where ETH may face a test. A consolidation above $3,000 could provide the springboard needed to challenge these higher thresholds.
In a bullish scenario, if Ethereum manages to sustain its current levels and market sentiment remains positive, there is a possibility of continued growth, potentially targeting the all-time highs seen previously. The RSI and volume will be key indicators to watch for sustaining buying pressure.
Solana still losing
Solana is currently exhibiting bearish tendencies. A close look at SOL's price trajectory reveals it is navigating through a potentially critical phase.

As of now, SOL is manifesting a downtrend within a bearish channel pattern. The price has recently faced resistance at the upper trend line of this channel, suggesting a possible continuation of bearish momentum. Key support levels to watch include the psychological round number at $100, followed by a more established support at around $90 which, if broken, could lead to a further slide.
If SOL fails to hold the $100 level, we could witness a steeper decline, with the next substantial support level at $90. A break below this could potentially open a path toward the $80 mark, especially if broader market sentiment remains negative.
A bullish reversal could occur if SOL finds solid footing at the current support levels. For a shift in trend, SOL would need to break out of the descending channel, pushing past the immediate resistance near $110. This could indicate short-term bearish exhaustion and potentially signal the start of a recovery phase, targeting subsequent resistance levels at $120 and above.
 Dan Burgin
 U.Today Editorial Team