*** Please note the analysis below is not investment advice. The views and opinions expressed here are solely those of the author and do not necessarily reflect the views of U.Today. Every investment and trading move involves risk, you should conduct your own research when making a decision.
Bitcoin possible confirmation areas
Last night Bitcoin made very strong and sick moves. The big guys shook off some buy and sell orders and hopefully, now they are satisfied. Like you see on the four-hour chart, one candle range is almost $500, recently this is the biggest shake off that we have seen but let's try to break down the price action and possible confirmations areas.
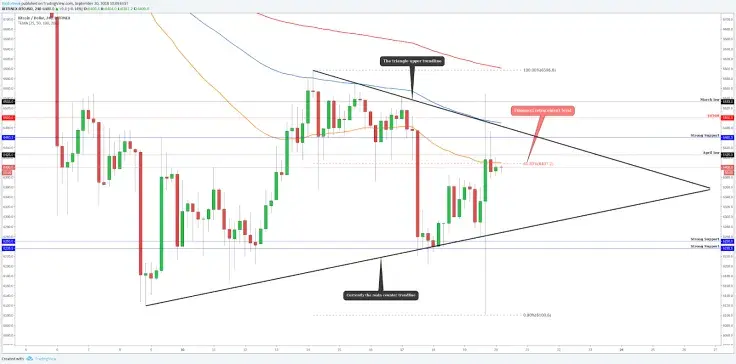
Currently, we trade on the triangle (black trendlines), the massive candle was below the triangle and it was above the triangle but the close was inside. Actually, this move was pretty good for the technical perspective that this could mean that probably we don't see those fake moves in the near future and technical analysis confirmation areas would be higher accuracy.
At the moment, on the four-hour chart, the price is 'sitting' on the Fibonacci retracement level at 62 percent and below the 50 EMA. Also, all our earlier mentioned level above the current price starts to work as a resistance:
- April low at $6,425
- Strong Resistance at $6,460
- Round number $6,500
- March low at $6,533
If we want to see another leg upwards then firstly, the biggest confirmation would be the upwards breakout from the triangle upper trendline. This is definitely hard to beat because this trendline makes a cross from those resistance levels and also, there is a 100 EMA which starts to work as a resistance but let's watch what we can get from the current levels and we have to take this step-by-step, confirmation after confirmation.
To confirm bearishness then a candle close below the $6,235 will confirm a movement downwards. If we get a candle close around $6,200 then we have a breakout from the triangle and break below the strong support levels.
To make the trades inside the triangle is very risky because we never know when they start to fool us. Be cautious!
Ethereum between the strong areas & ready to make a breakout
Currently, Ethereum trades between the round number $200 and between the two trendlines:
- The longer & smoother since Jan. 4th and 2nd touch Aug. 14.
Sept. 5th Ethereum breaks below this trendline, which had to work as a support, but now when we are below the mentioned trendline it works as a resistance. It has five to six attempts to break back above this trendline but those are failed and we can say that this trendline is pretty significant confirmation if we want to see bullish Ethereum. - The trendline since July 29 which is pulled from bodies.
Lately, there has been just one attempt to break through but this attempt was exactly on the trendlines crossing area and those crossing areas are extremely strong.
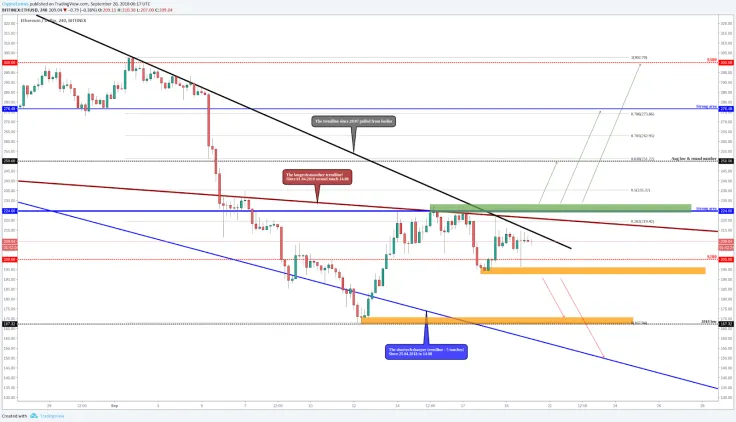
Let's count the resistances that we have to take down before we can say that ETH is on the bullish trend and those resistances are pretty heavy to beat:
- The mentioned longer and smoother trendline: as you know we have several failed attempts to break back above the current trendline.
- The trendline since July 29.
- The strong area (blue line) which has worked historically as a good support level and as a good resistance level. Several attempts to either direction and if it breaks or touched it Ethereum has bounced every time. So, we can assume, if ETH can take down this level at $225 we could see another leg upwards
- Different timeframes EMA's
The targets after the breakout:
- Semi-round number $250- this area matching also with the August low point and also we can see that the perfect Fibonacci retracement level 62 percent is in this area.
- Around $280- the second strong area on the chart which has historically worked very well!
- Sept. high around $300
To give you a short-term bearish confirmation, there could be a four-hour candle close below the orange zone around the $190 (higher one). The close below the mentioned area confirms that we have a break below the round number ($200) and we have to make a short-term lower low. This will guide us to the 2018 low point at $167 which is made on the Sept. 12. It should start to work as a good support level but if it breaks then the next 'hope' comes from the blue trendline around $150 but let's see what the price action start to show us and especially what the market starts to show.
 Dan Burgin