*** Please note the analysis below is not investment advice. The views and opinions expressed here are solely those of the author and do not necessarily reflect the views of U.Today. Every investment and trading move involves risk, you should conduct your own research when making a decision.
Bitcoin important areas, what you need to watch
Yesterday, we discovered a bullish chart pattern called "Inverted Head & Shoulders", the right and the left shoulders were located precisely on the perfect Fibonacci retracement level at 62 percent, and after we made a break above that blue support/resistance line where the price made a pretty nice jump upwards. From the price structure perspective, this bounce occurred from a 'healthy' place, because Bitcoin made a short-term HL (higher low) which is very important if we want to see a short-term bullish BTC.
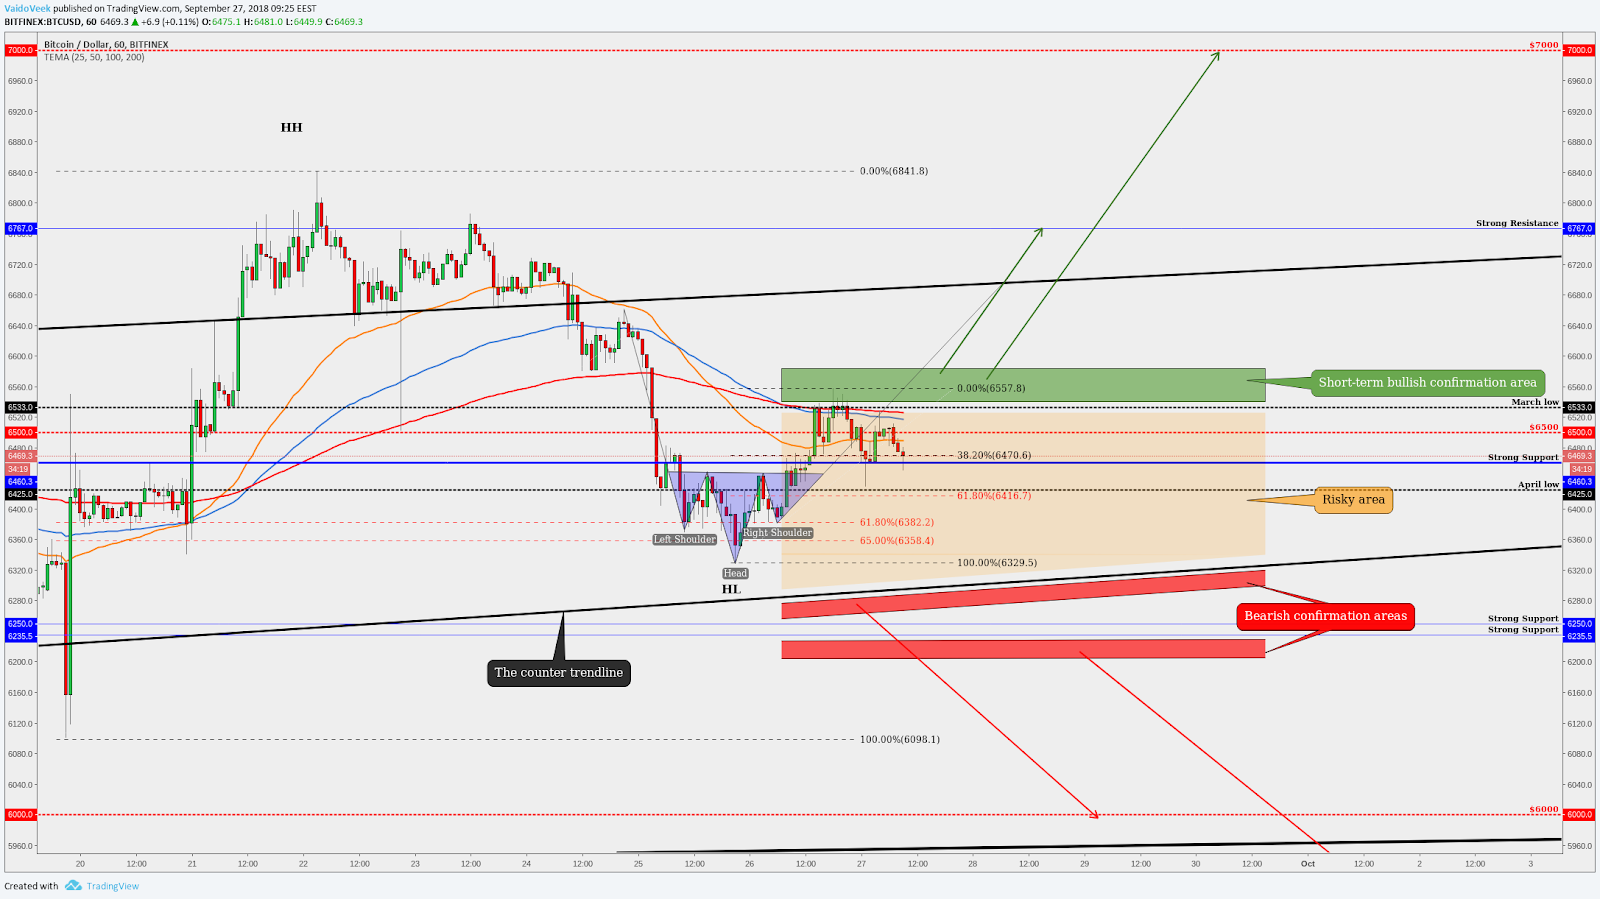
So, this pattern worked almost perfectly and BTC price reached $6,560. However, now it has a second phase, we started to make a retest to the pattern neckline. Overnight we got a retest and after that, on the one-hour timeframe, it formed a bullish candlestick “Hammer” pattern, with a little bounce upwards above $6,500 where the momentum stops. Currently, we are approaching for the second time this strong support area (blue line) and the Fibonacci 38 percent retracement area but let's see if this level holds the price because there are technically some bad signs. We are below the short-term up-trendline and this could start playing a role in this bounce.
Technically it is ready to go higher if we get a bounce from the strong support level but there is nothing clear before we are above those well-known resistance levels ($6,500 the round number which works as a resistance and March low level which also starts to work as a resistance, plus we have the EMA's above the current price, it should confirm bullishness if we can make a break above them).
If BTC manages to break above those resistance levels and it gets a close on the green box, then we are out of the risky area which will indicate that we might go and test the higher levels.
The first target would be the strong resistance at $6,767 and the second target would be around $7,000. Between those levels are the well-known Fibonacci level 62 percent around $6,900, lots of people are guessing that this might be the place where we go down again, but I think opposite: this is just so well-known price level, everybody knows it and if it reaches into this area then it flies above.
To give to you bearish confirmations then it would be those red 'boxes.’ The first one is a break below the major counter trendline, if we get a break below the trendline then it will show that the short-term up trendline doesn't work as is should and the downward pressure is still pretty massive and the second confirmation is a close below those strong support blue line. If the price reaches there, then please be cautious because we might test the very low levels. Try to stay away from the market if it happens.
DASH (DASH/USD) is under the major trendlines
The market has shown some ups and downs movements and so has DASH.
Last week, DASH was technically pretty good but it didn't catch that big momentum and currently, it is in a bearish area. It is below both major trendline, below the short-term down-trendline which is pulled from July 20th and below the major counter trendline which will indicate that the upwards momentum is over. We could see a pullback if the market doesn't make any fast recoveries. Also, DASH trades below the EMA's which also is not a good sign.
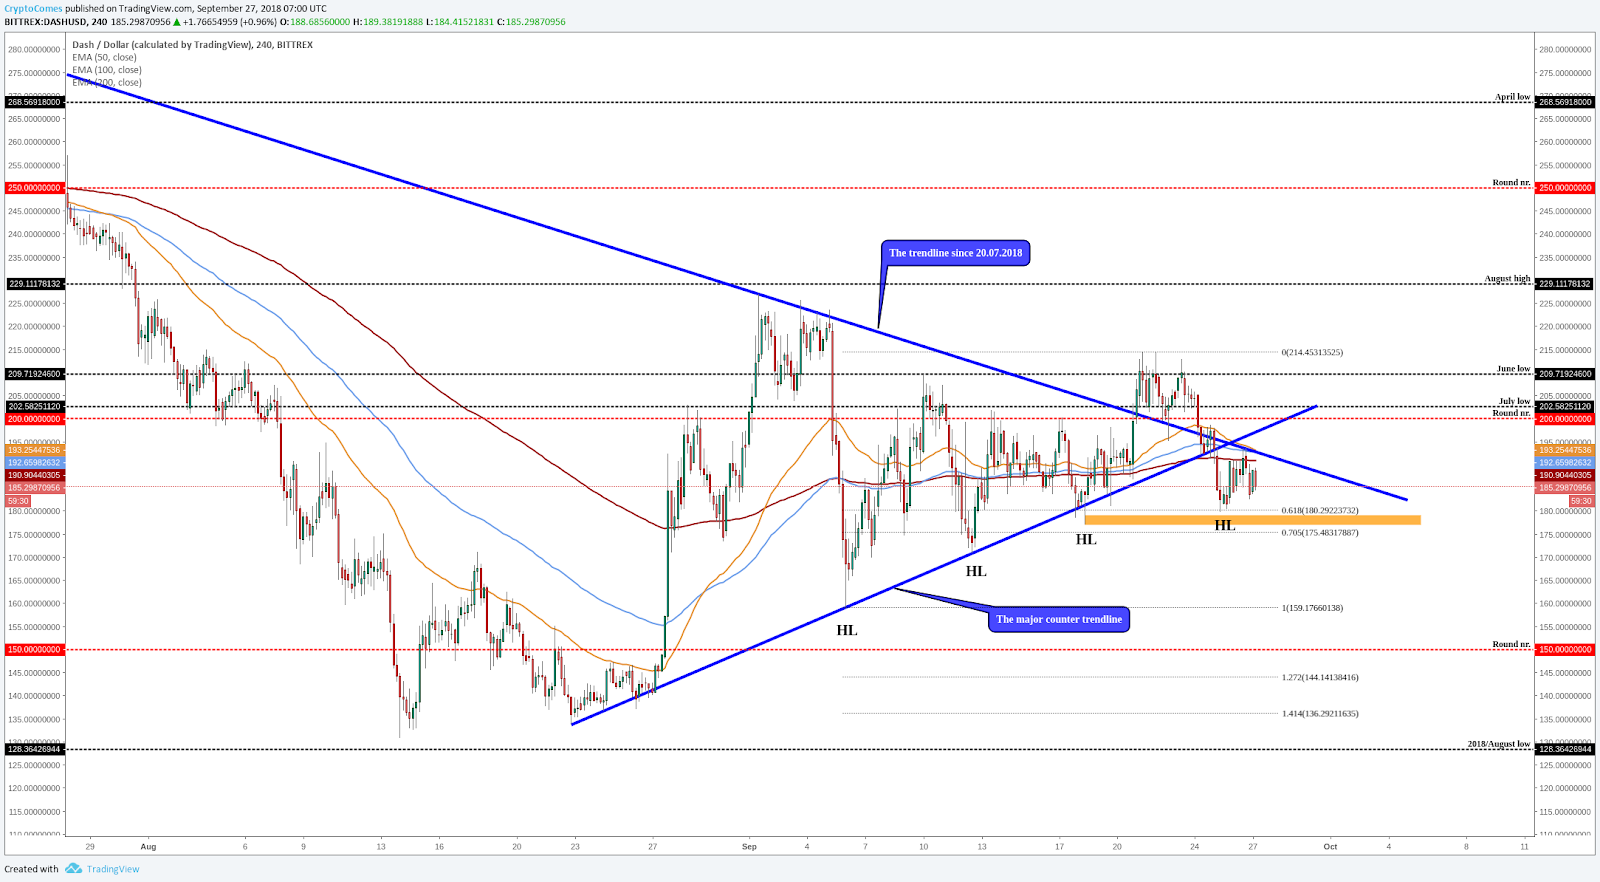
However, alongside these bad signs, we also have a good sign. The current short-term bounce comes from the Fibonacci 62 percent retracement level which still printed a higher low (HL) onto the chart. So, if we stay above this orange area, then all is under control, but if we can't hold the price above that mentioned level, we might see a bigger correction downwards.
To be bullish, we have to break above again those trendlines or at least above that trendline which is pulled from July 20th. 'The road' upwards is pretty hard but if the market starts a bull run then all the altcoins start a bull run but if the market stays stable then DASH is on the trouble and definitely, it needs a big volume to break above those trendlines and EMA's.
Ethereum (ETH/USD) has a breakout from the bearish pattern
Ethereum has made a breakout from the bearish pattern called "Rising Wedge.” This is a continuation pattern and like you know the overall trend is down and if it makes breakout downwards it confirms that we might go to test the lower levels.
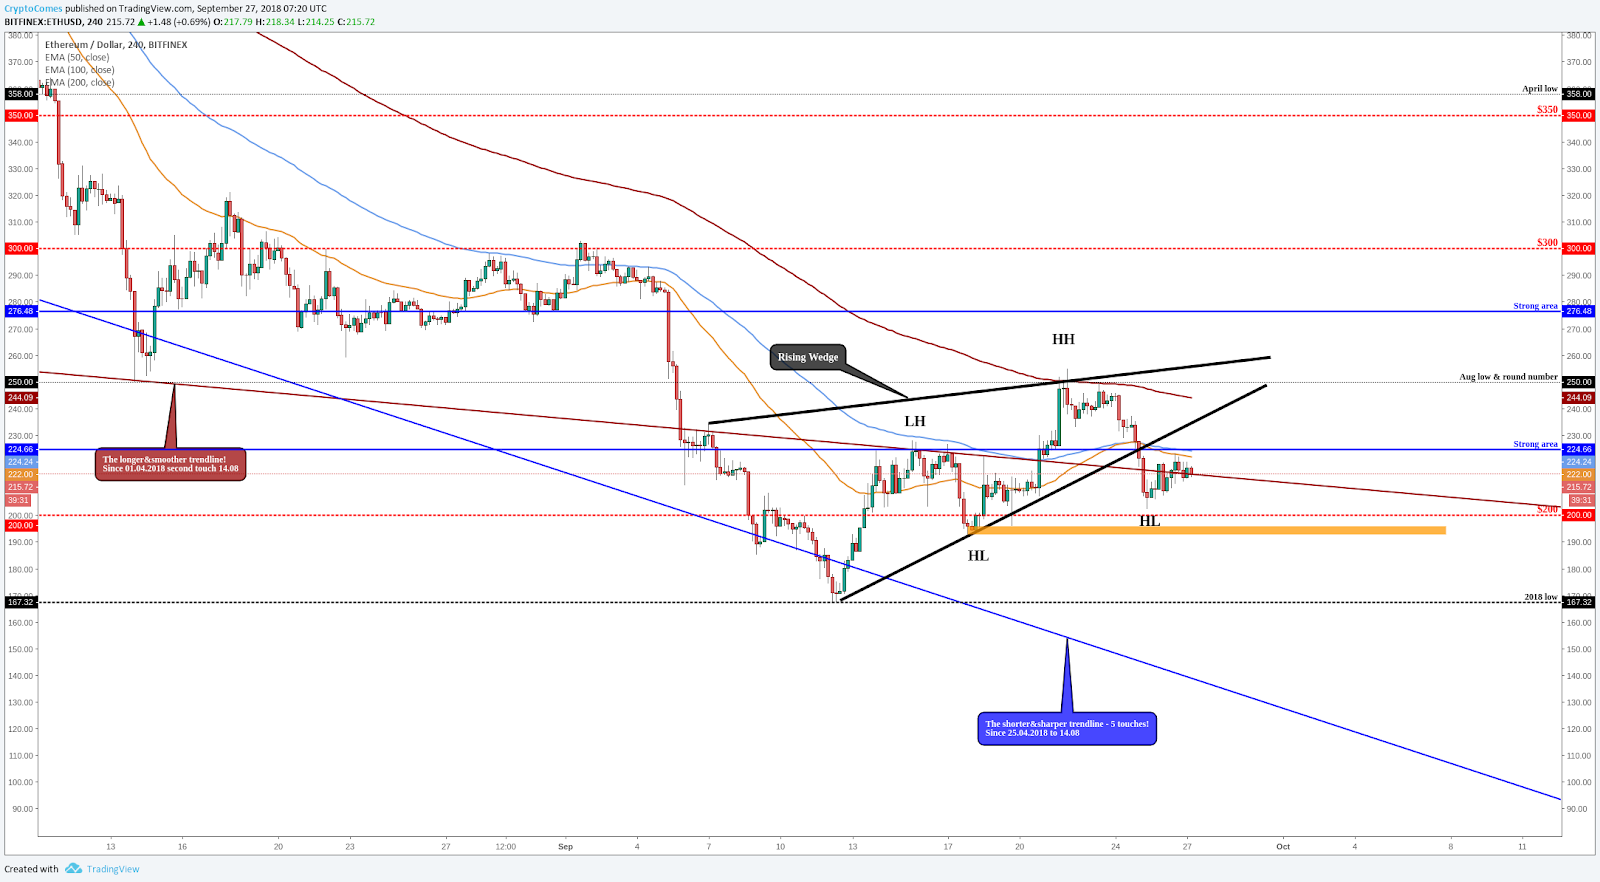
Currently, after the breakout, ETH price finds support slightly above the round number $200 and it made a higher low (HL). At the moment it fights with the trendline which is pulled from April 1st. This is a pretty significant trendline because it has respected it pretty nicely and if it breaks above then we have next strong resistance (blue line at $225) so, the price is on the risky area and it is hard to break above if we don't see a pump.
A bearish confirmation is a close below the orange area. If we get a candle close below this, then we have a break below the round number $200 and the price structure will make a new short-term lower low.
 Dan Burgin