
The first day of the weekend has been negative for most of the coins in the Top 10 list. However, there also some exceptions. EOS for example, has shot up the most by 3.59% since yesterday.
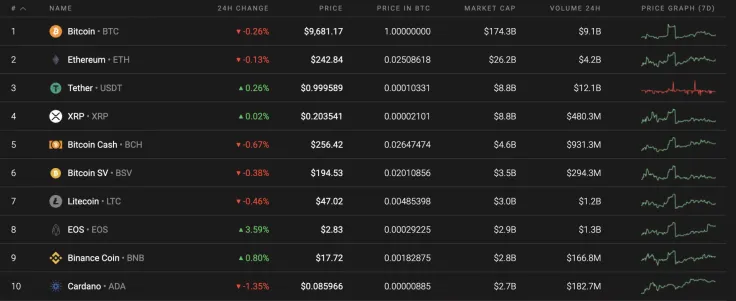
Below is the key data for Bitcoin (BTC), Ethereum (ETH), XRP, Bitcoin Cash (BCH), Bitcoin SV (BSV), and Litecoin (LTC):
|
Name |
Ticker Advertisement
|
Market Cap |
Price |
Volume (24H) Advertisement
|
Change (24H) |
|
Bitcoin |
BTC |
$178,125,612,028 |
$9,682.81 |
$22,296,854,896 |
-0.37% |
|
Ethereum |
ETH |
$27,068,013,054 |
$243.34 |
$8,656,571,856 |
-0.10% |
|
XRP |
XRP |
$8,983,525,753 |
$0.203649 |
$1,111,871,229 |
0.06% |
|
Bitcoin Cash |
BCH | $4,728,346,590 | $256.59 | $1,871,182,442 | -0.69% |
|
Bitcoin SV |
BSV | $3,591,524,836 | $194.92 | $1,245,954,049 | -0.28% |
|
Litecoin |
LTC | $3,062,782,467 | $47.20 | $2,355,978,729 | -0.63% |
BTC/USD
Bitcoin (BTC) has lost part of its value since yesterday. The decline has gone down 0.51%; however, the rise in short-term prospects remains.
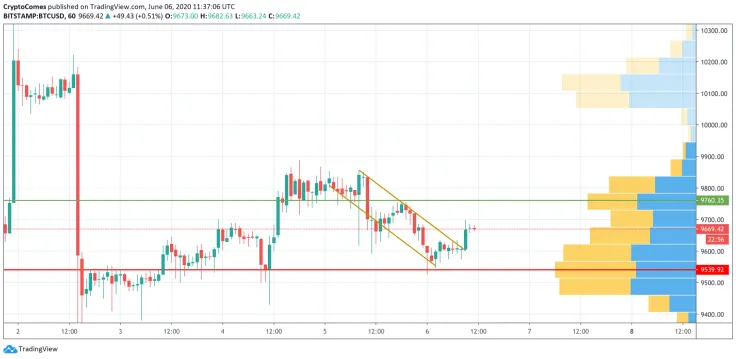
Looking at the hourly chart, Bitcoin (BTC) has bounced off its $9,600 support zone. Usually, the trading activity is quite low, which suggests that it is unlikely to see a sharp up or downswing. Even though sellers continue to push the rate down since its fall from $10,000, a short rise between the $9,760-$9,800 zone can occur in the near future.
At press time, Bitcoin was trading at $9,692.
ETH/USD
Ethereum (ETH) is trading similarly to Bitcoin (BTC) as a short-term prospect. The price of the coin has gone up 0.59% since yesterday. Over the last week, the rise has constituted an increase of 4.55%.
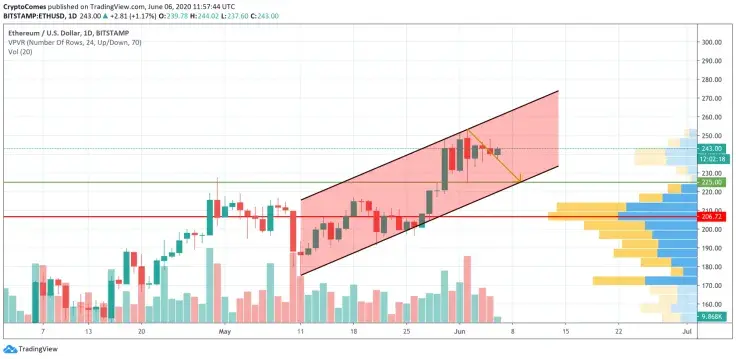
Looking at the daily time frame, the growth from the last few days was not accompanied by the rising trading volume. As a result, the coin has stuck in a narrow range.
One more reason for a continued decline is the absence of liquidity. All in all, one might consider that the blast above $250 was a false breakout, followed by an upcoming dump. In this particular case, the closest resistance is the $225 mark.
At press time, Ethereum was trading at $244.05.
XRP/USD
If Bitcoin (BTC) and Ethereum (ETH) have the potential to rise on the weekends, XRP has a low probability of doing the same thing. The rate for the third most popular crypto has gone up by 0.02%.
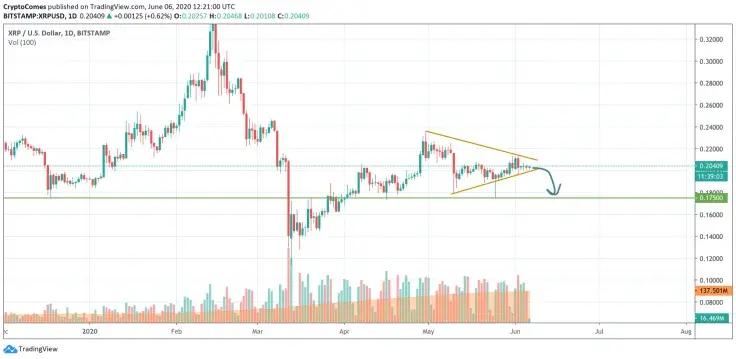
Looking at the daily chart, XRP is about to finish a Triangle formation. As the trend has changed from bullish to bearish, the pattern is about to breakdown with the endpoint at $0.1750. It is supported by the fact that buyers do not have the strength to push the rate higher, which is outlined in the trading volume.
At press time, XRP was trading at $0.2037.
BCH/USD
After trading in a rising channel since mid-March 2020, Bitcoin Cash (BCH) also has a bearish trend. The rate for BTC's most popular fork has dropped by 0.60% in the last 24 hours.
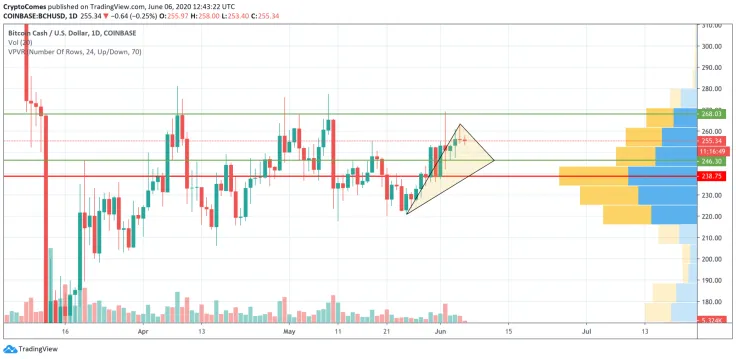
having confirmed the false breakout, Bitcoin Cash (BCH) has retested the $268 height. Currently, there is a high probability of forming a Triangle pattern, which will confirm the start of a change in trend. Such a statement is supported by the lack of liquidity and a decrease in buying trading volume. To sum it up, the $246.30 support zone might be attained next week.
At press time, Bitcoin Cash was trading at $255.68.
BSV/USD
Bitcoin SV (BSV) is looking a little bit better than Bitcoin Cash (BCH). The rate for the coin has gone down by 0.23% since yesterday.
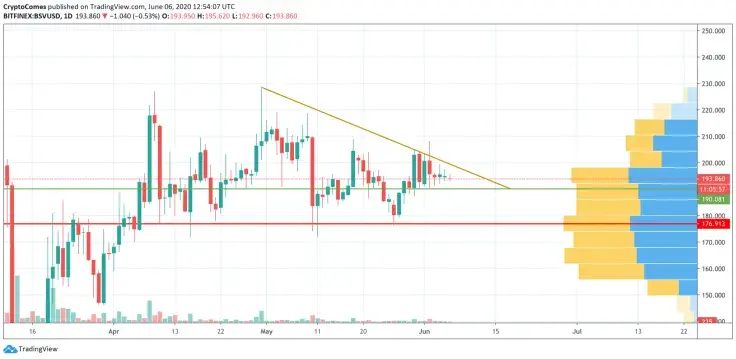
According to the chart, the falling line has not been broken. This suggests that the recent high was the local peak, followed by an upcoming drop. Looking at the daily time frame, one can notice long candle wicks, which is a bearish signal. If Bitcoin SV (BSV) continues to fall, then the first stop is at $190.
At press time, Bitcoin SV was trading at $193.97.
LTC/USD
Litecoin (LTC) is also unlikely to grow in the relative short-term. Since yesterday, the coin has dropped by 0.43%.
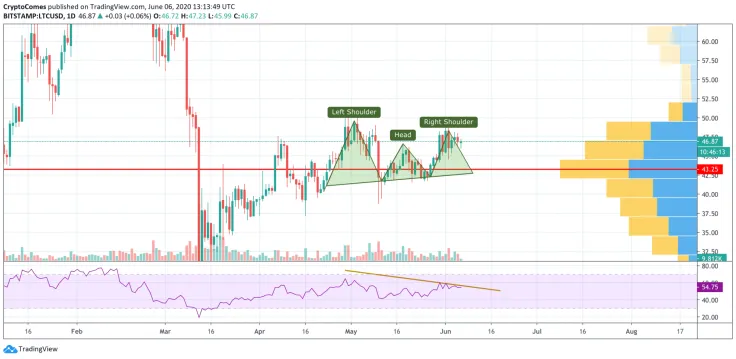
Looking at the daily time frame, the 'digital silver' is forming a Head and Shoulders pattern. In this particular case, the level of the Right Shoulder will be at the $43.25 mark. The probability of a decline is also supported by the bearish divergence on the Relative Strength Index (RSI), as well as a decline in trading volume. To sum it up, the bullish trend that started in mid-March is about to come to an end.
At press time, Litecoin was trading at $46.87.
 Vladislav Sopov
 Dan Burgin