Disclaimer: The opinions expressed by our writers are their own and do not represent the views of U.Today. The financial and market information provided on U.Today is intended for informational purposes only. U.Today is not liable for any financial losses incurred while trading cryptocurrencies. Conduct your own research by contacting financial experts before making any investment decisions. We believe that all content is accurate as of the date of publication, but certain offers mentioned may no longer be available.
The cryptocurrency market is neither bullish nor bearish as some coins keep trading in the green zone while others have already turned red.
BTC/USD
The selling pressure was not strong yesterday morning. Bears failed to push through the level of $43,360. The price of Bitcoin (BTC) pierced it, but buyers slowly reclaimed the area of $44,600 in the afternoon.
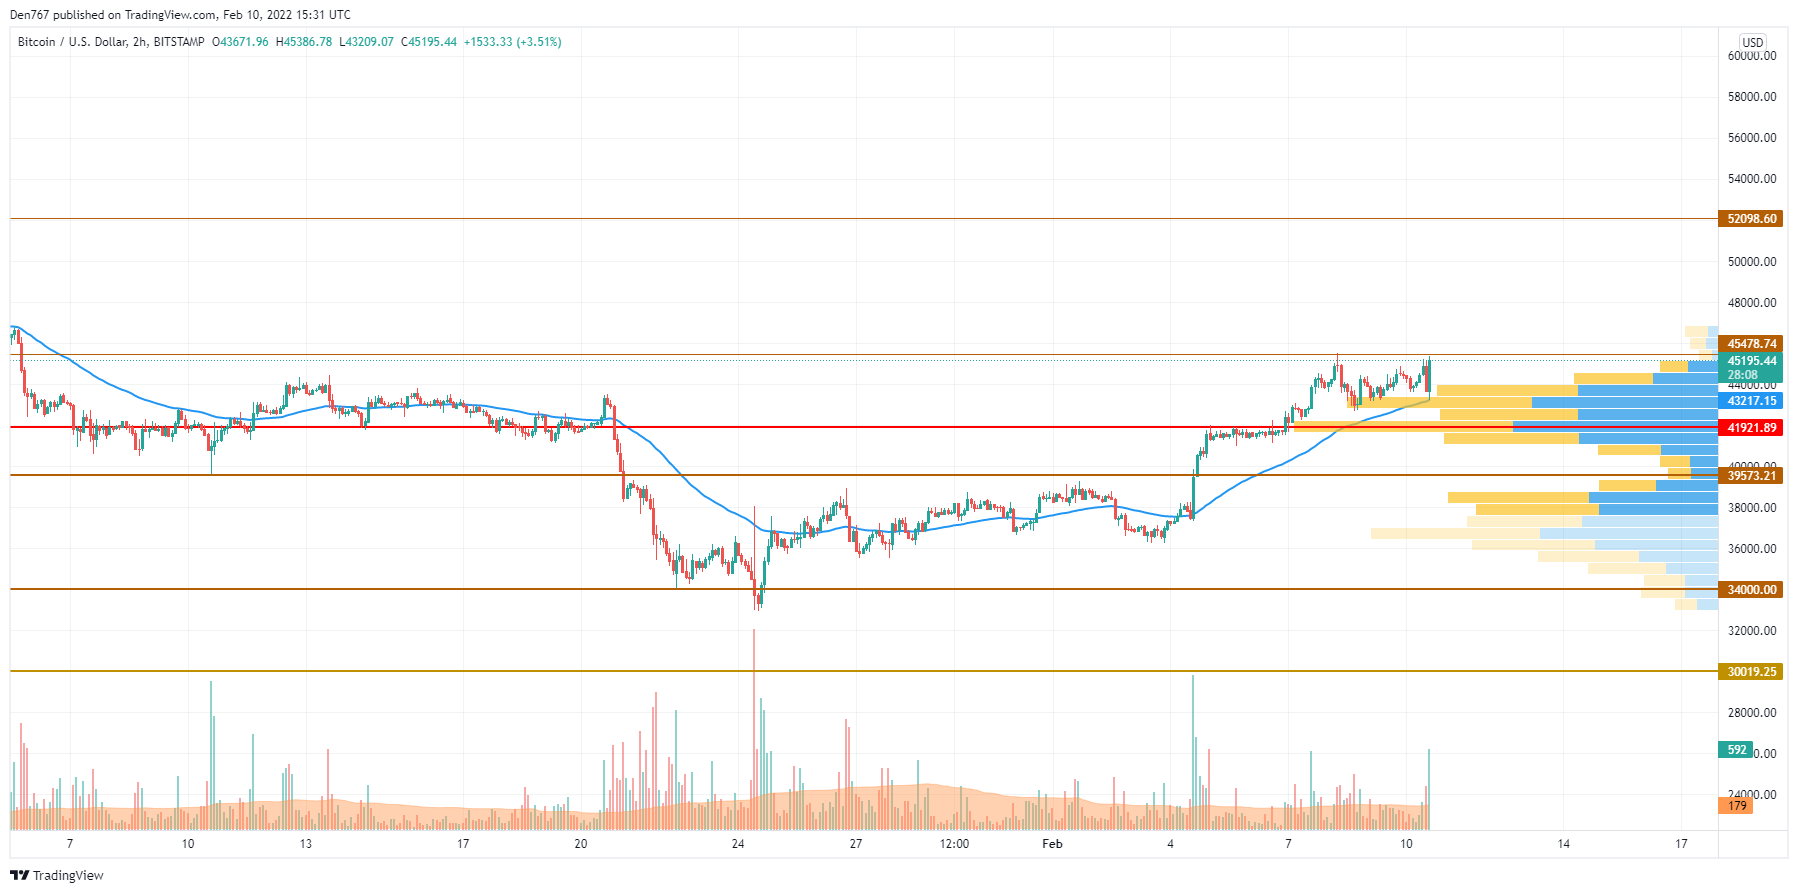
By the end of the day, bulls were close to the re-test of $45,000, but the buying volumes were below average, and their efforts were insufficient. Over the past night, the price of BTC has rolled back a bit. This morning, the pair is holding around the $43,800 mark. In the first half of the day, a pullback to yesterday's support of $43,360 is still possible. If it does not stop the rollback, then the decline can reach a more powerful support level of $42,450.
It is possible that the bulls might try to make another assault on the resistance of $46,000.
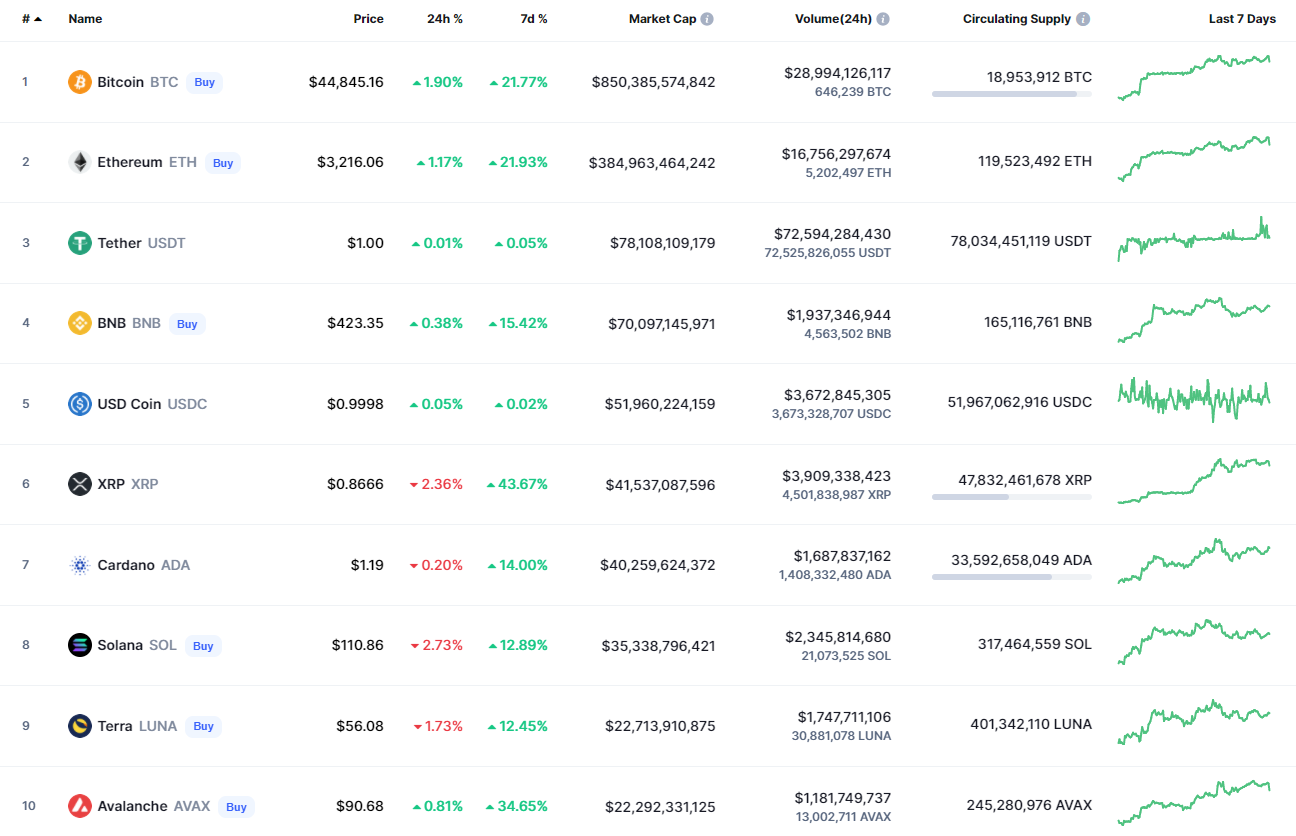
Bitcoin is trading at $45,145 at press time.
ETH/USD
Yesterday morning, trading volumes were below average and the nightly ETH price rollback did not continue further towards EMA55.
Buyers managed to push the pair back to the resistance area of $3,200, breaking through to the zone of a new February high because of powerful bullish momentum.
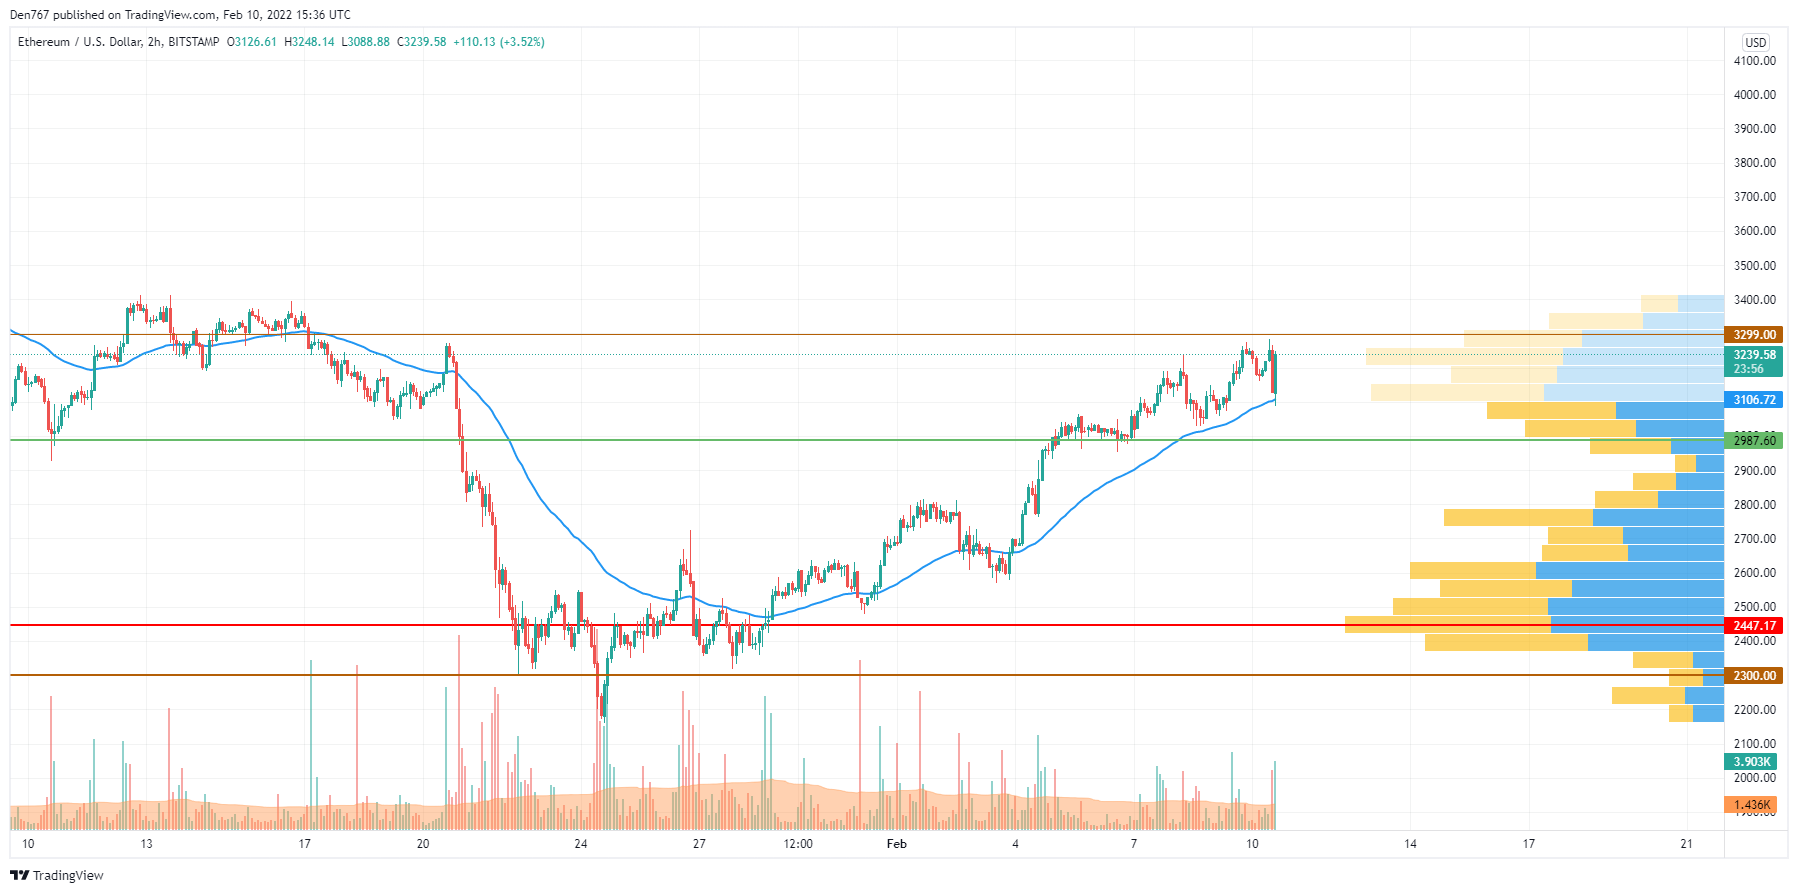
Until the end of the day, it achieved a new high of $3,275. At night, the pair slipped back below the level of $3,200. Due to overbought conditions, it is still difficult for buyers to reclaim yesterday's high zone. If today they fail to cope with the resistance of $3,200, then the price can retreat to the psychological support of $3,000.
Ethereum is trading at $3,236 at press time.
BNB/USD
The price of Binance Coin (BNB) has been almost unchanged since yesterday.
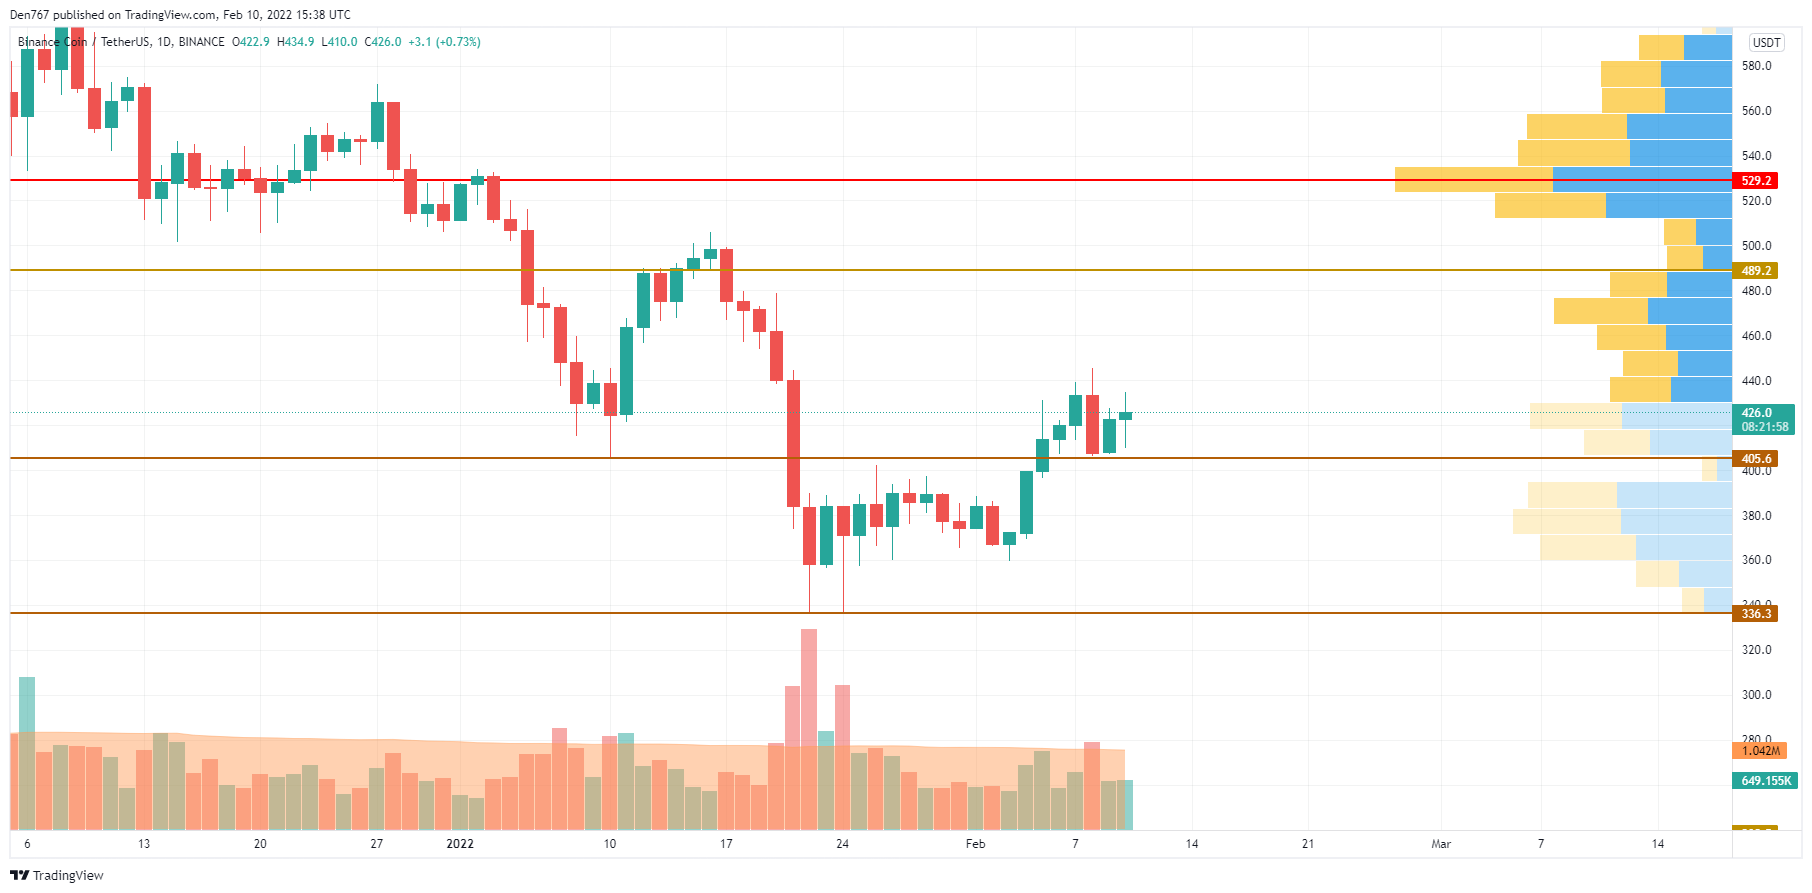
The price of Binance Coin (BNB) is trading above the support level at $405, which means that buyers remain more powerful than sellers. If they can get to $440, there is a chance of seeing continued growth to the next resistance level at $489.
BNB is trading at $426.2 at press time.
LUNA/USD
The price of LUNA has come back to the red zone, falling by 0.14% over the last 24 hours.
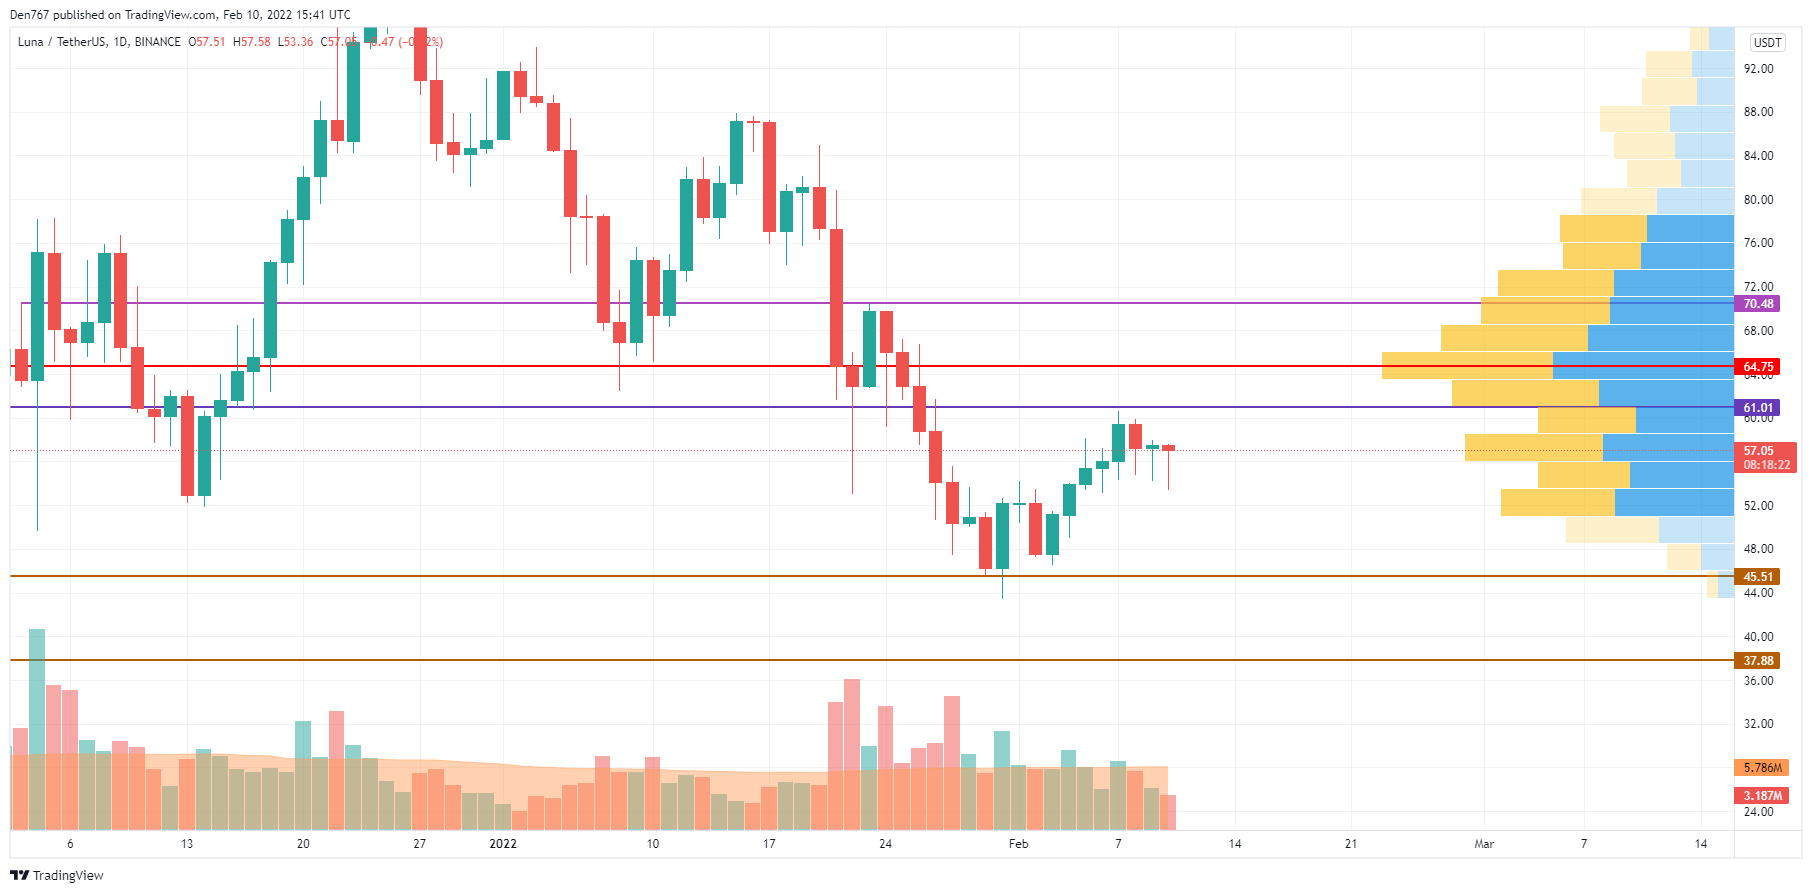
Despite the decline, LUNA is approaching the resistance level at $61.01 amid declining selling trading volume. If the daily candle fixes around $60, there is a chance of seeing a price breakout by the end of the week.
LUNA is trading at $57.07 at press time.
SOL/USD
Solana (SOL) is underperforming LUNA, dropping roughly 1.02%.
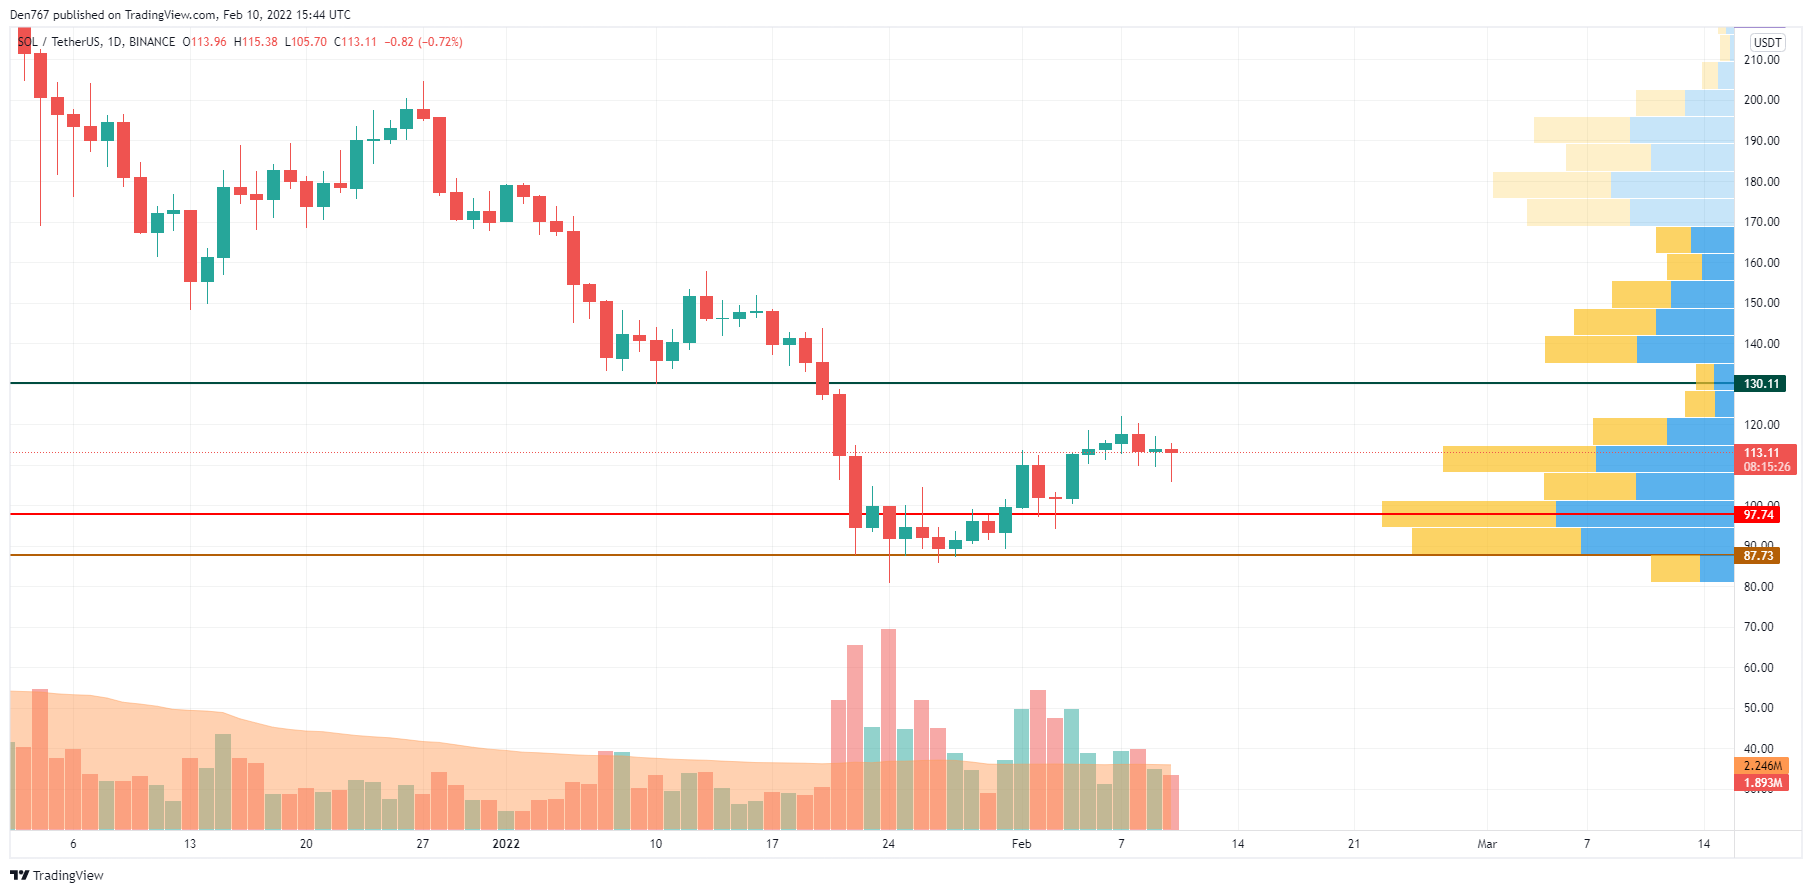
Solana (SOL) is located in the middle of the channel, which means that sideways trading is the most likely scenario for the upcoming days. However, if the price returns to the zone of the most liquidity around $90, the fall may continue to the support level at $87.73.
SOL is trading at $112.71 at press time.
AVAX/USD
AVAX is located in the green zone, going up by 2.48% since yesterday.
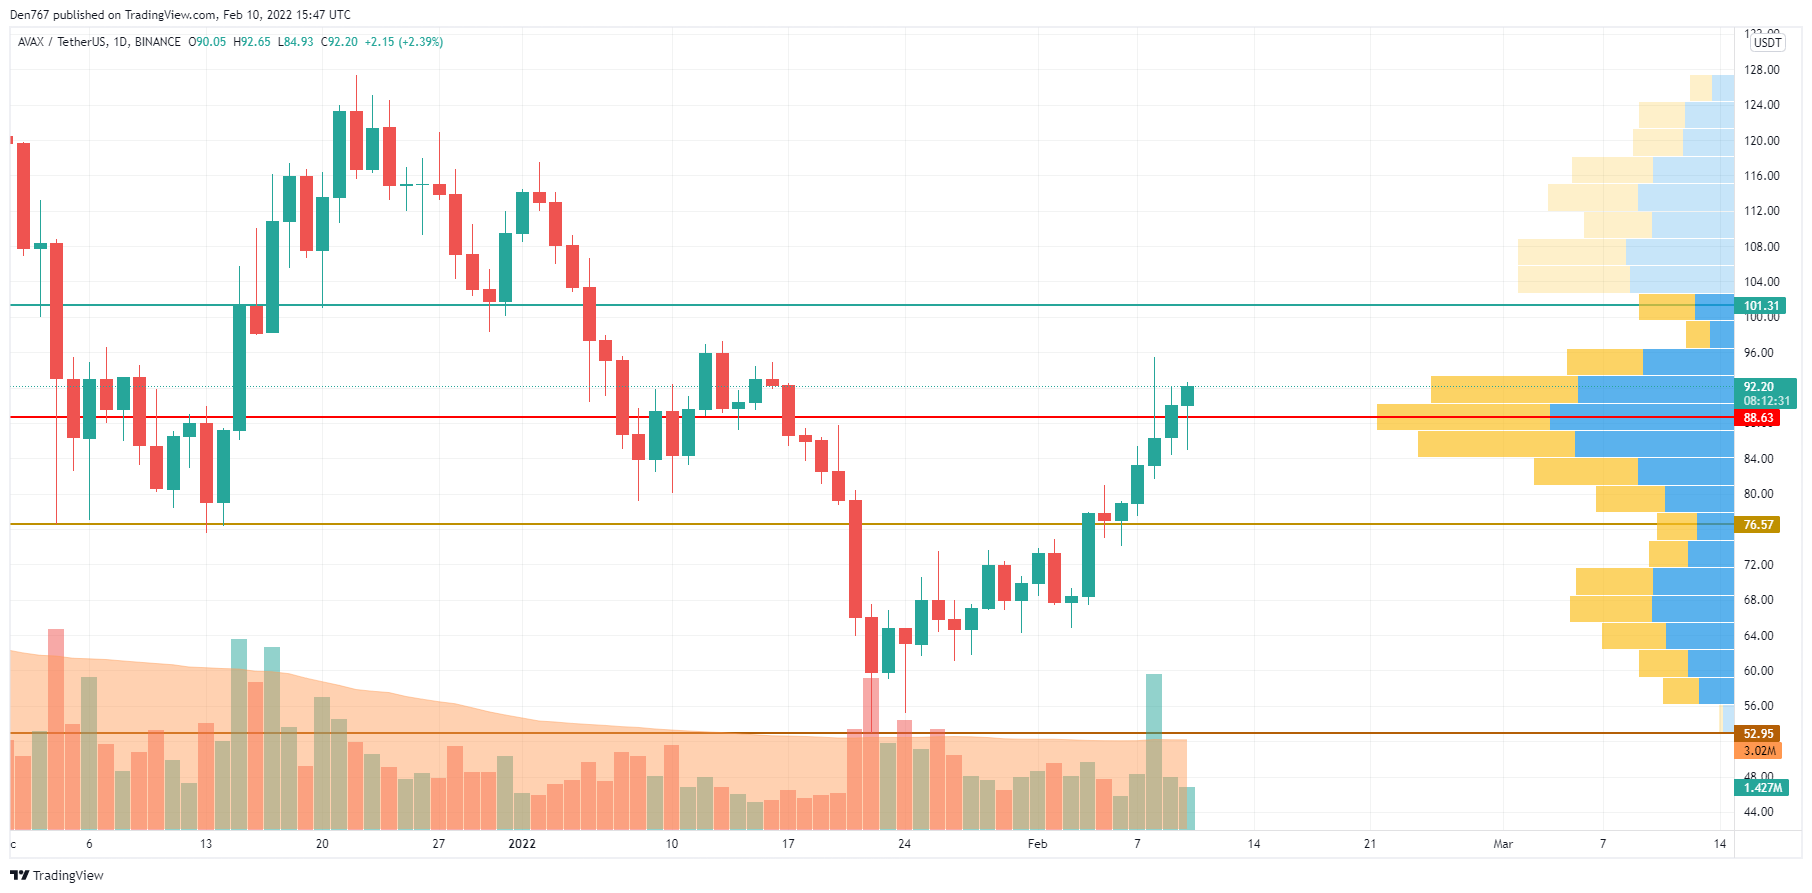
Avalanche (AVAX) has fixed above the zone of the most liquidity at $88.63. If bulls can hold this level, the ongoing rise may push it to the green resistance level at $101.31. Such a scenario is relevant until the end of the week.
AVAX is trading at $92.11 at press time.
DOT/USD
Polkadot (DOT) has joined the red zone, going down by 0.10% over the last 24 hours.
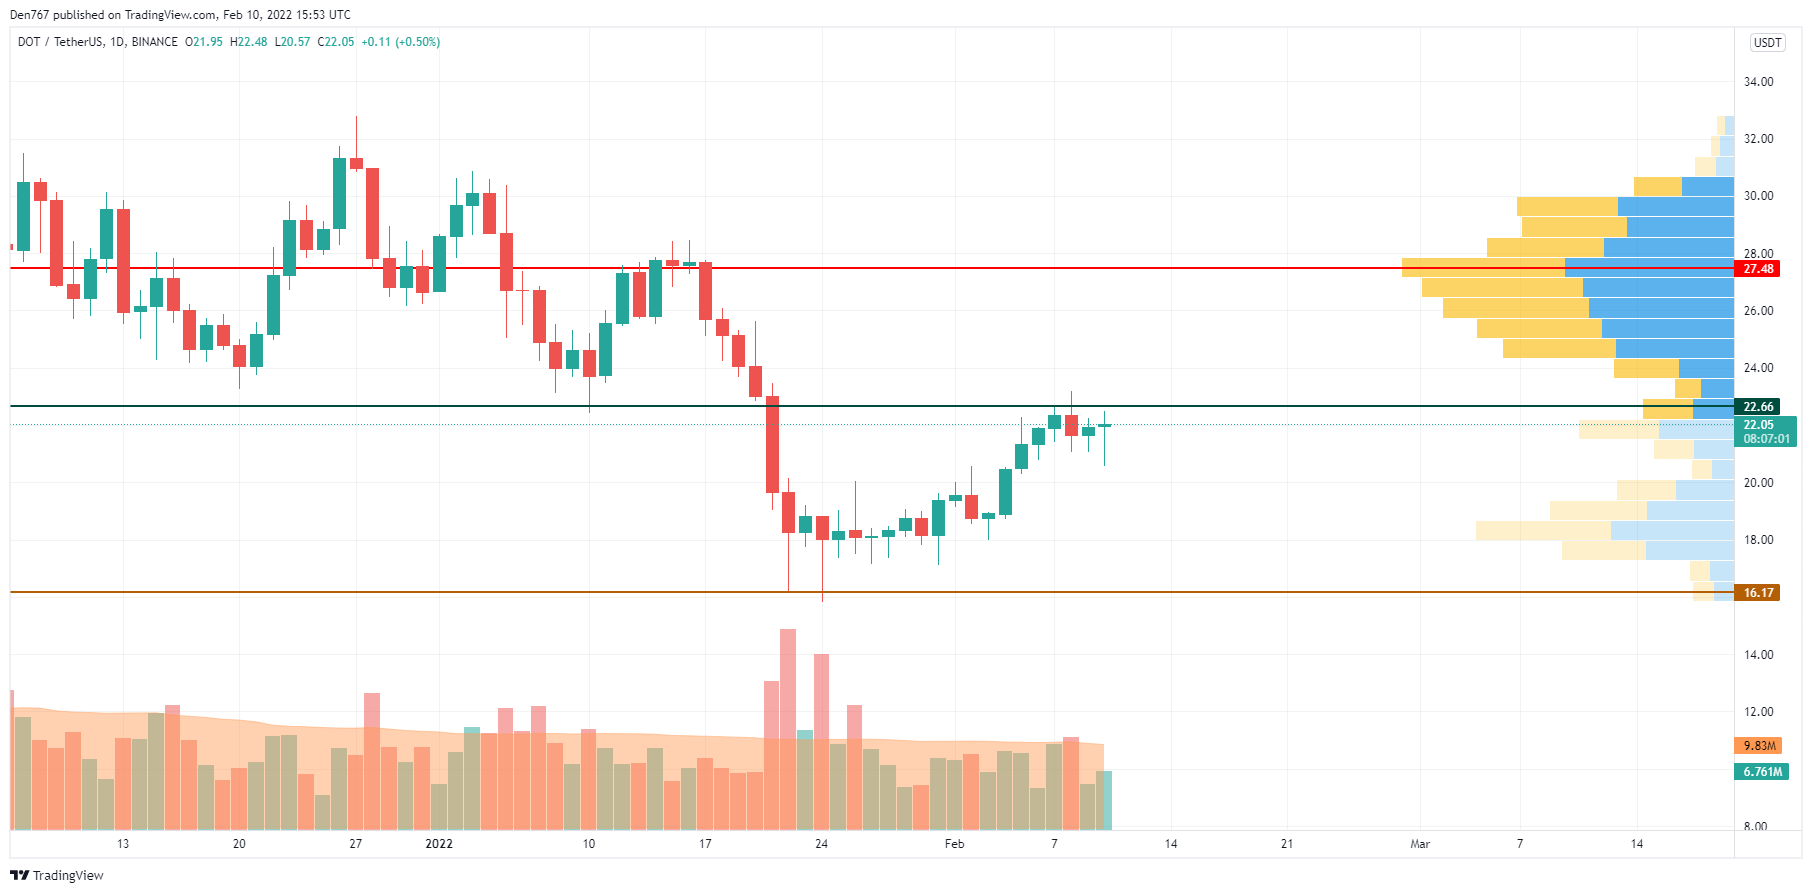
Polkadot (DOT) is approaching the resistance level at $22.66. The buying trading volume is increasing, which means that there is a high probability of seeing a price breakout soon. If that occurs, the rise may push the price of DOT to $25.
DOT is trading at $21.72 at press time.
 Dan Burgin
 U.Today Editorial Team