Disclaimer: The opinions expressed by our writers are their own and do not represent the views of U.Today. The financial and market information provided on U.Today is intended for informational purposes only. U.Today is not liable for any financial losses incurred while trading cryptocurrencies. Conduct your own research by contacting financial experts before making any investment decisions. We believe that all content is accurate as of the date of publication, but certain offers mentioned may no longer be available.
After a few days of growth, bulls have faced obstacles on their way up as most of the coins have returned to the red zone.
BTC/USD
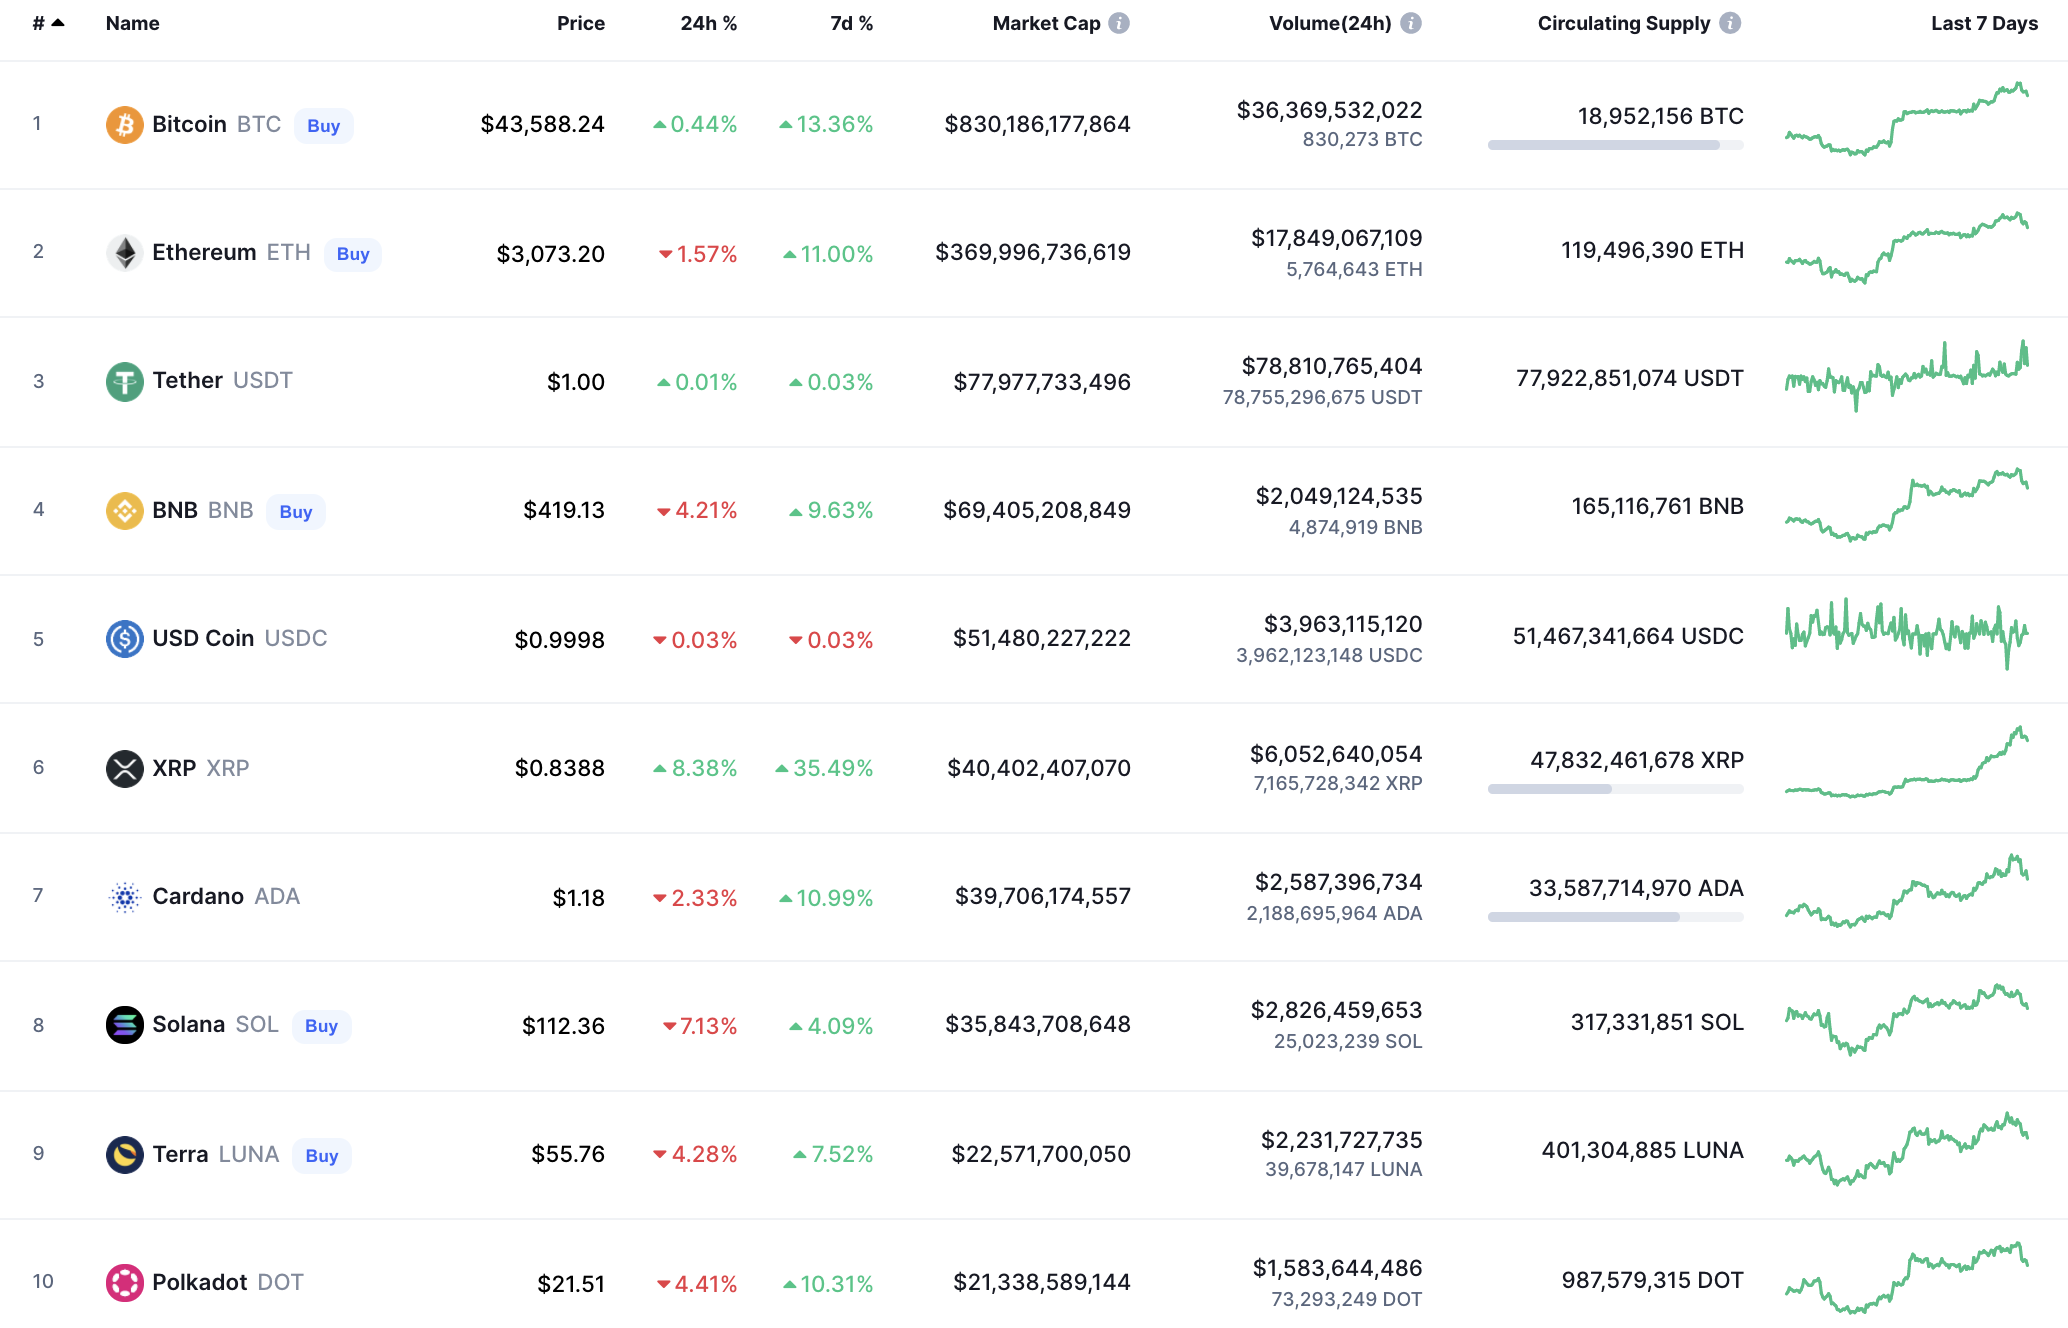
The rate of Bitcoin (BTC) is almost unchanged since yesterday, with growth of only 0.44%.
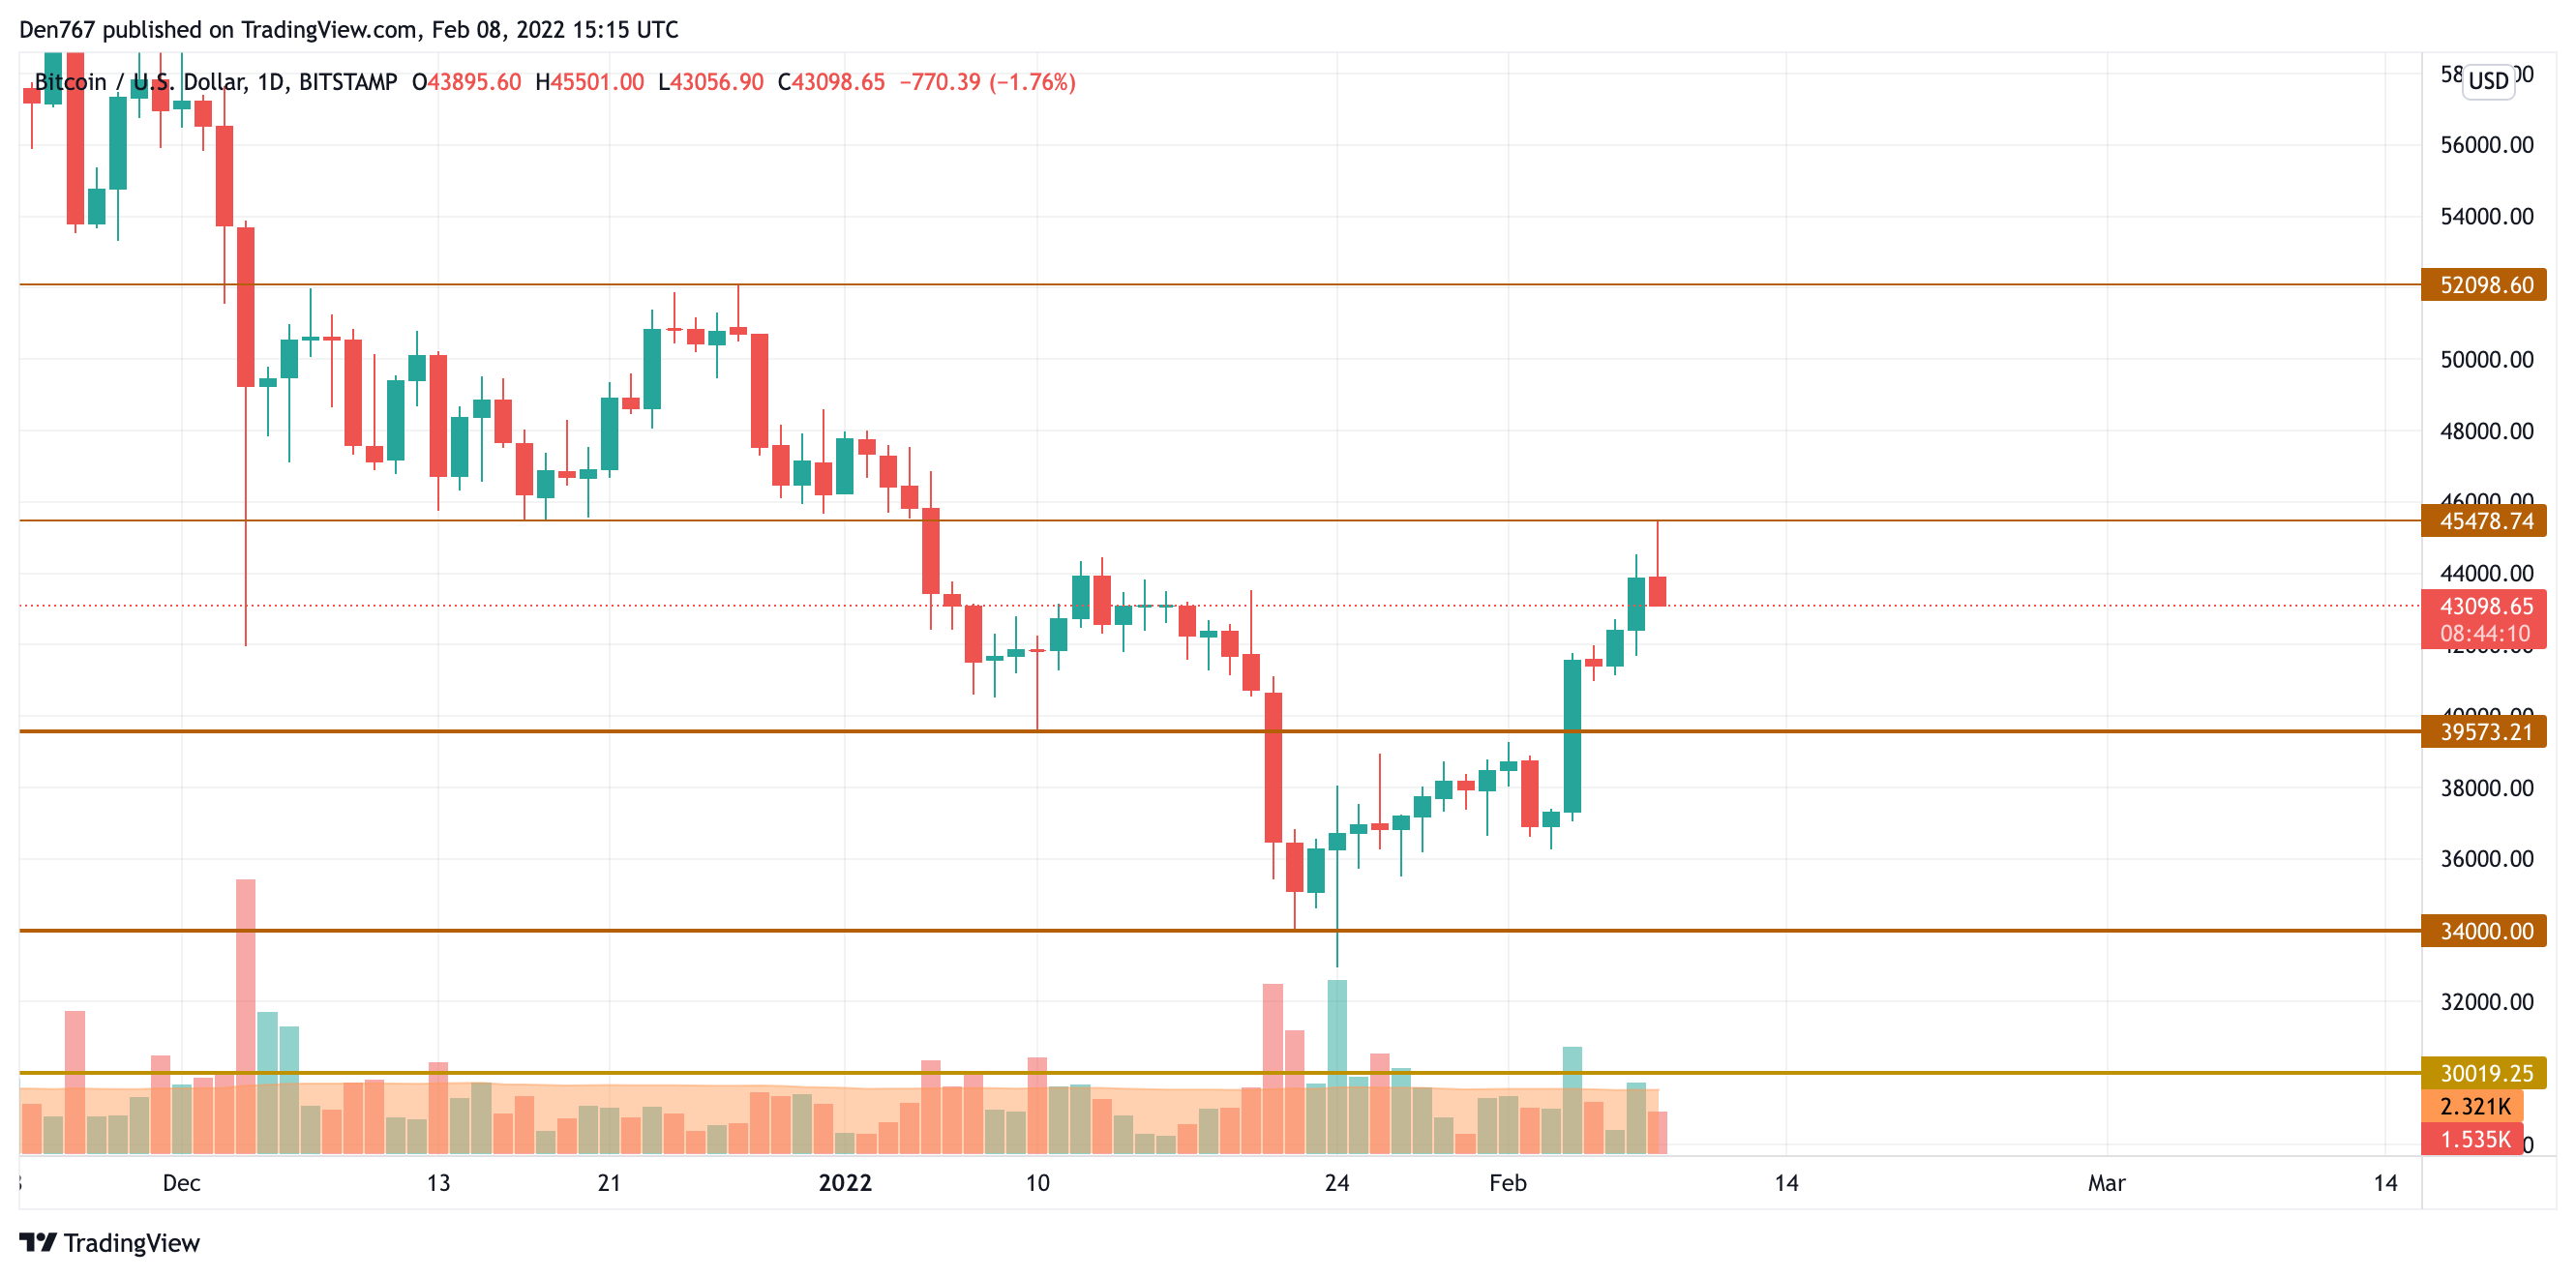
On the daily chart, Bitcoin (BTC) made a false breakout of the resistance level at $45,478. At the moment, buyers are out of energy to keep the rise going.

In this case, if the decline continues, there is a chance to see the test of the recently formed mirror level at $39,573.
Bitcoin is trading at $43,098 at press time.
ETH/USD
The rate of Ethereum (ETH) has gone down by 1.57% over the last 24 hours.
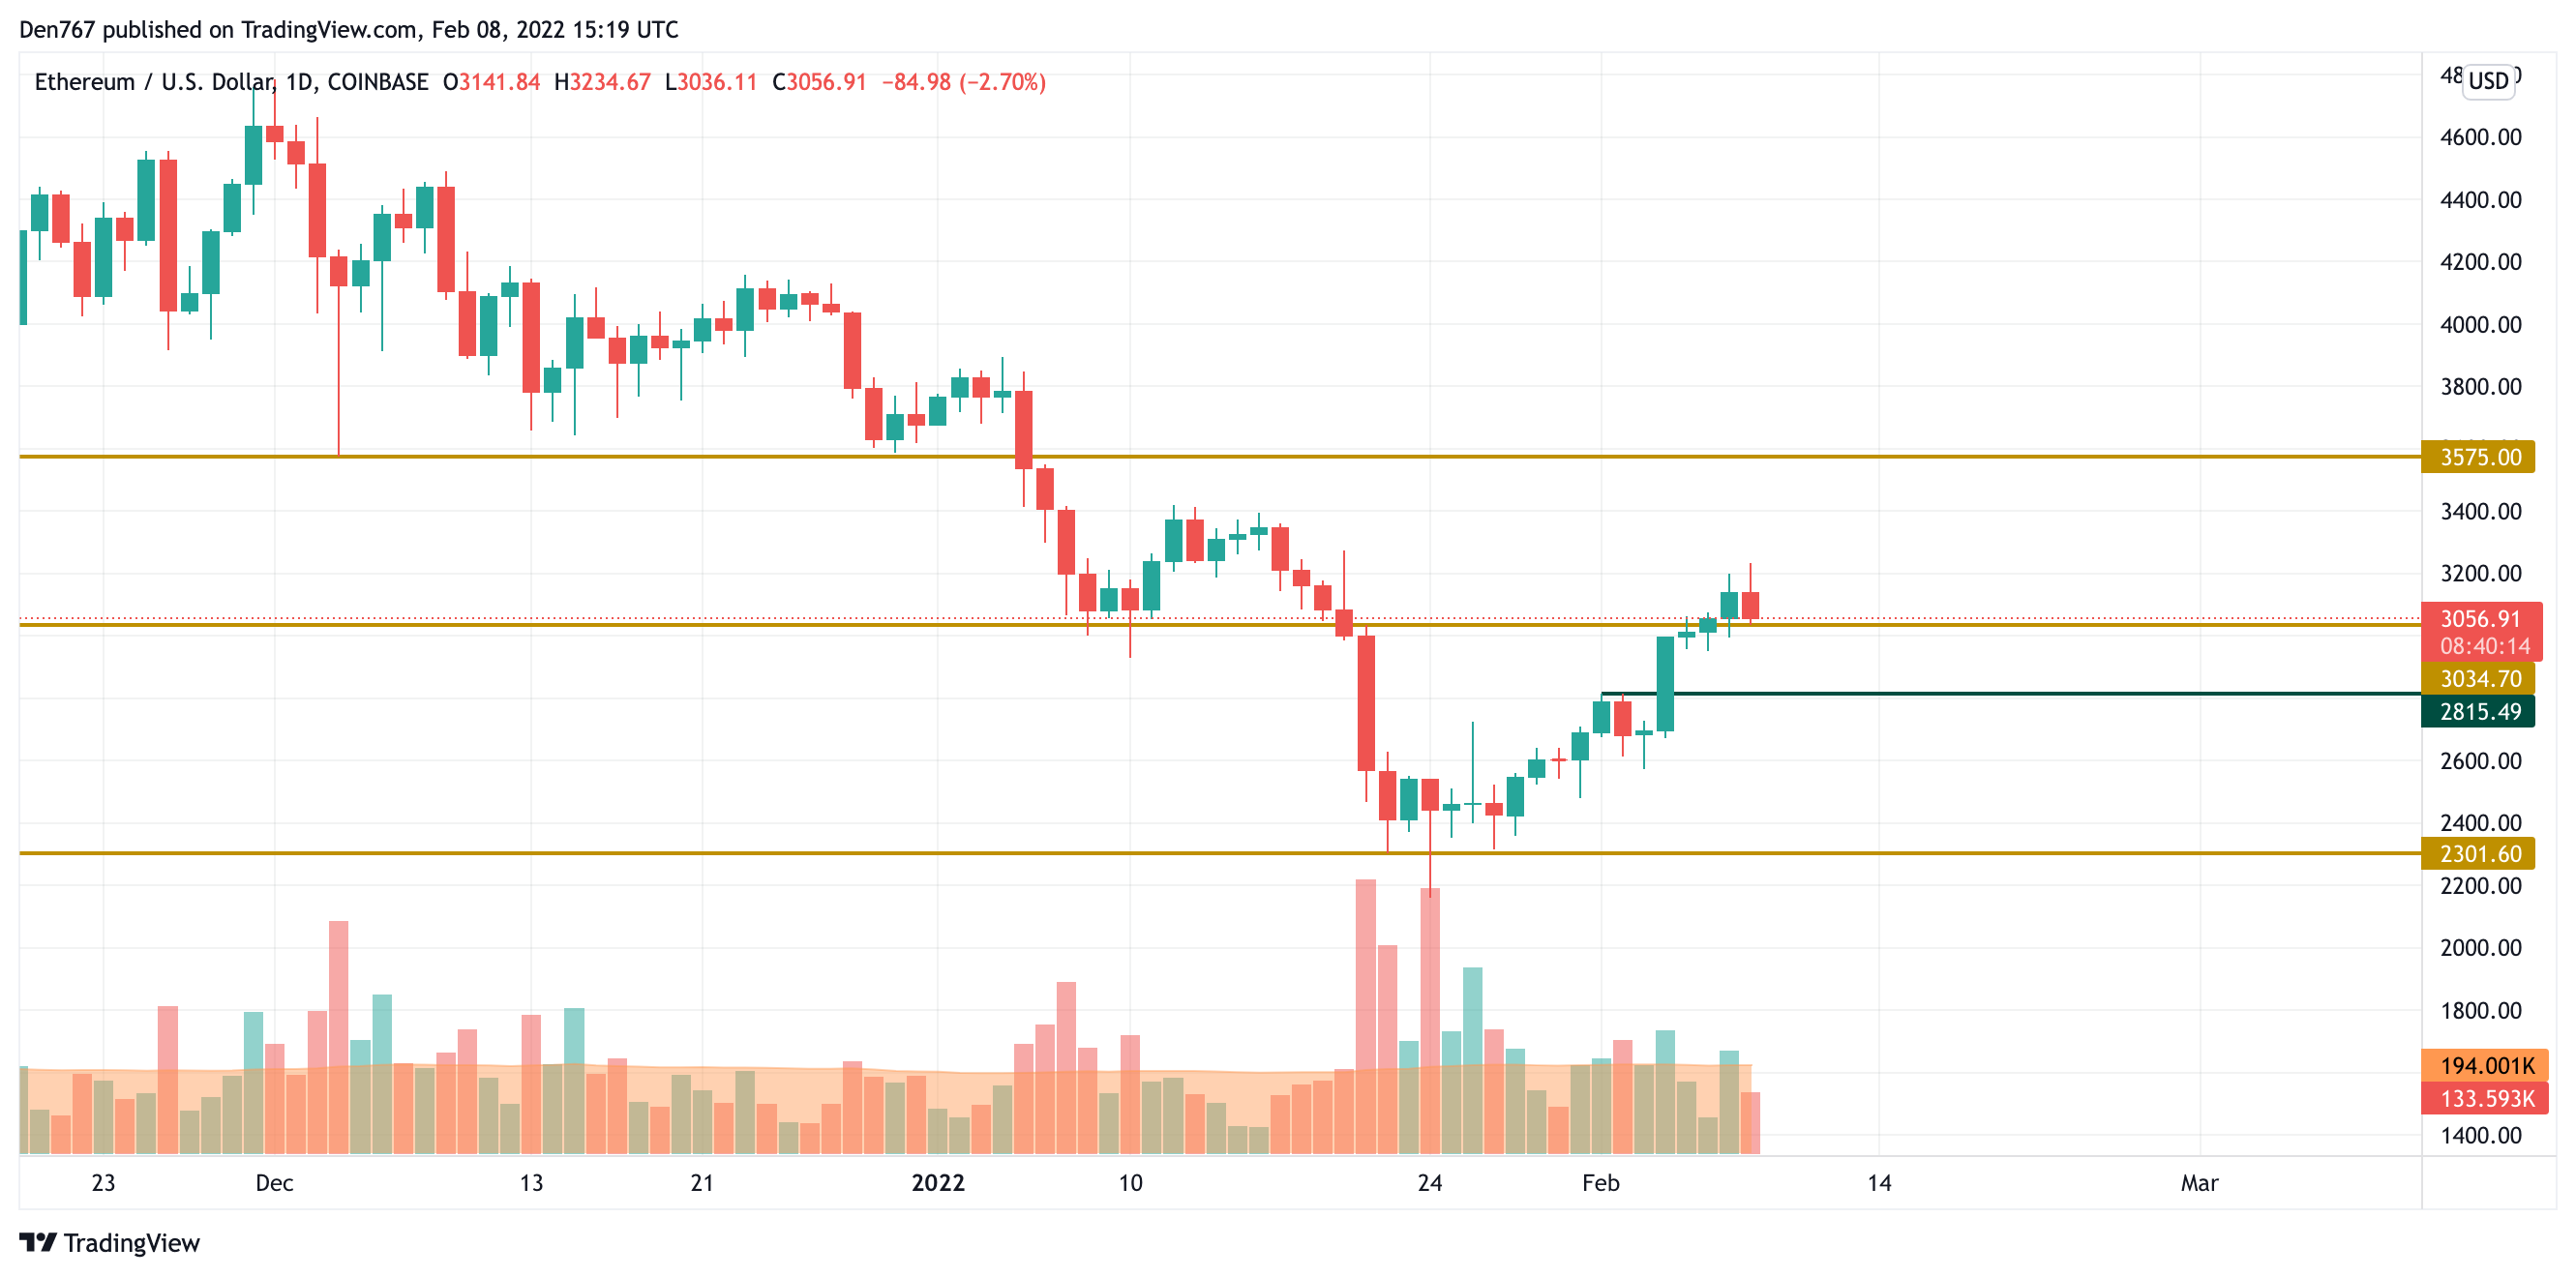
Despite the fall, the leading altcoin remains trading above the support level at $3,034. Until bulls can hold the vital mark of $3,000, one may expect continued growth to the area of $3,500.
In case bears keep the pressure and the price goes below $3,000, the drop may lead the rate of ETH to $2,815.
Ethereum is trading at $3,056 at press time.
SOL/USD
Solana (SOL) is the biggest loser from the list today with a decrease of 7.71%.
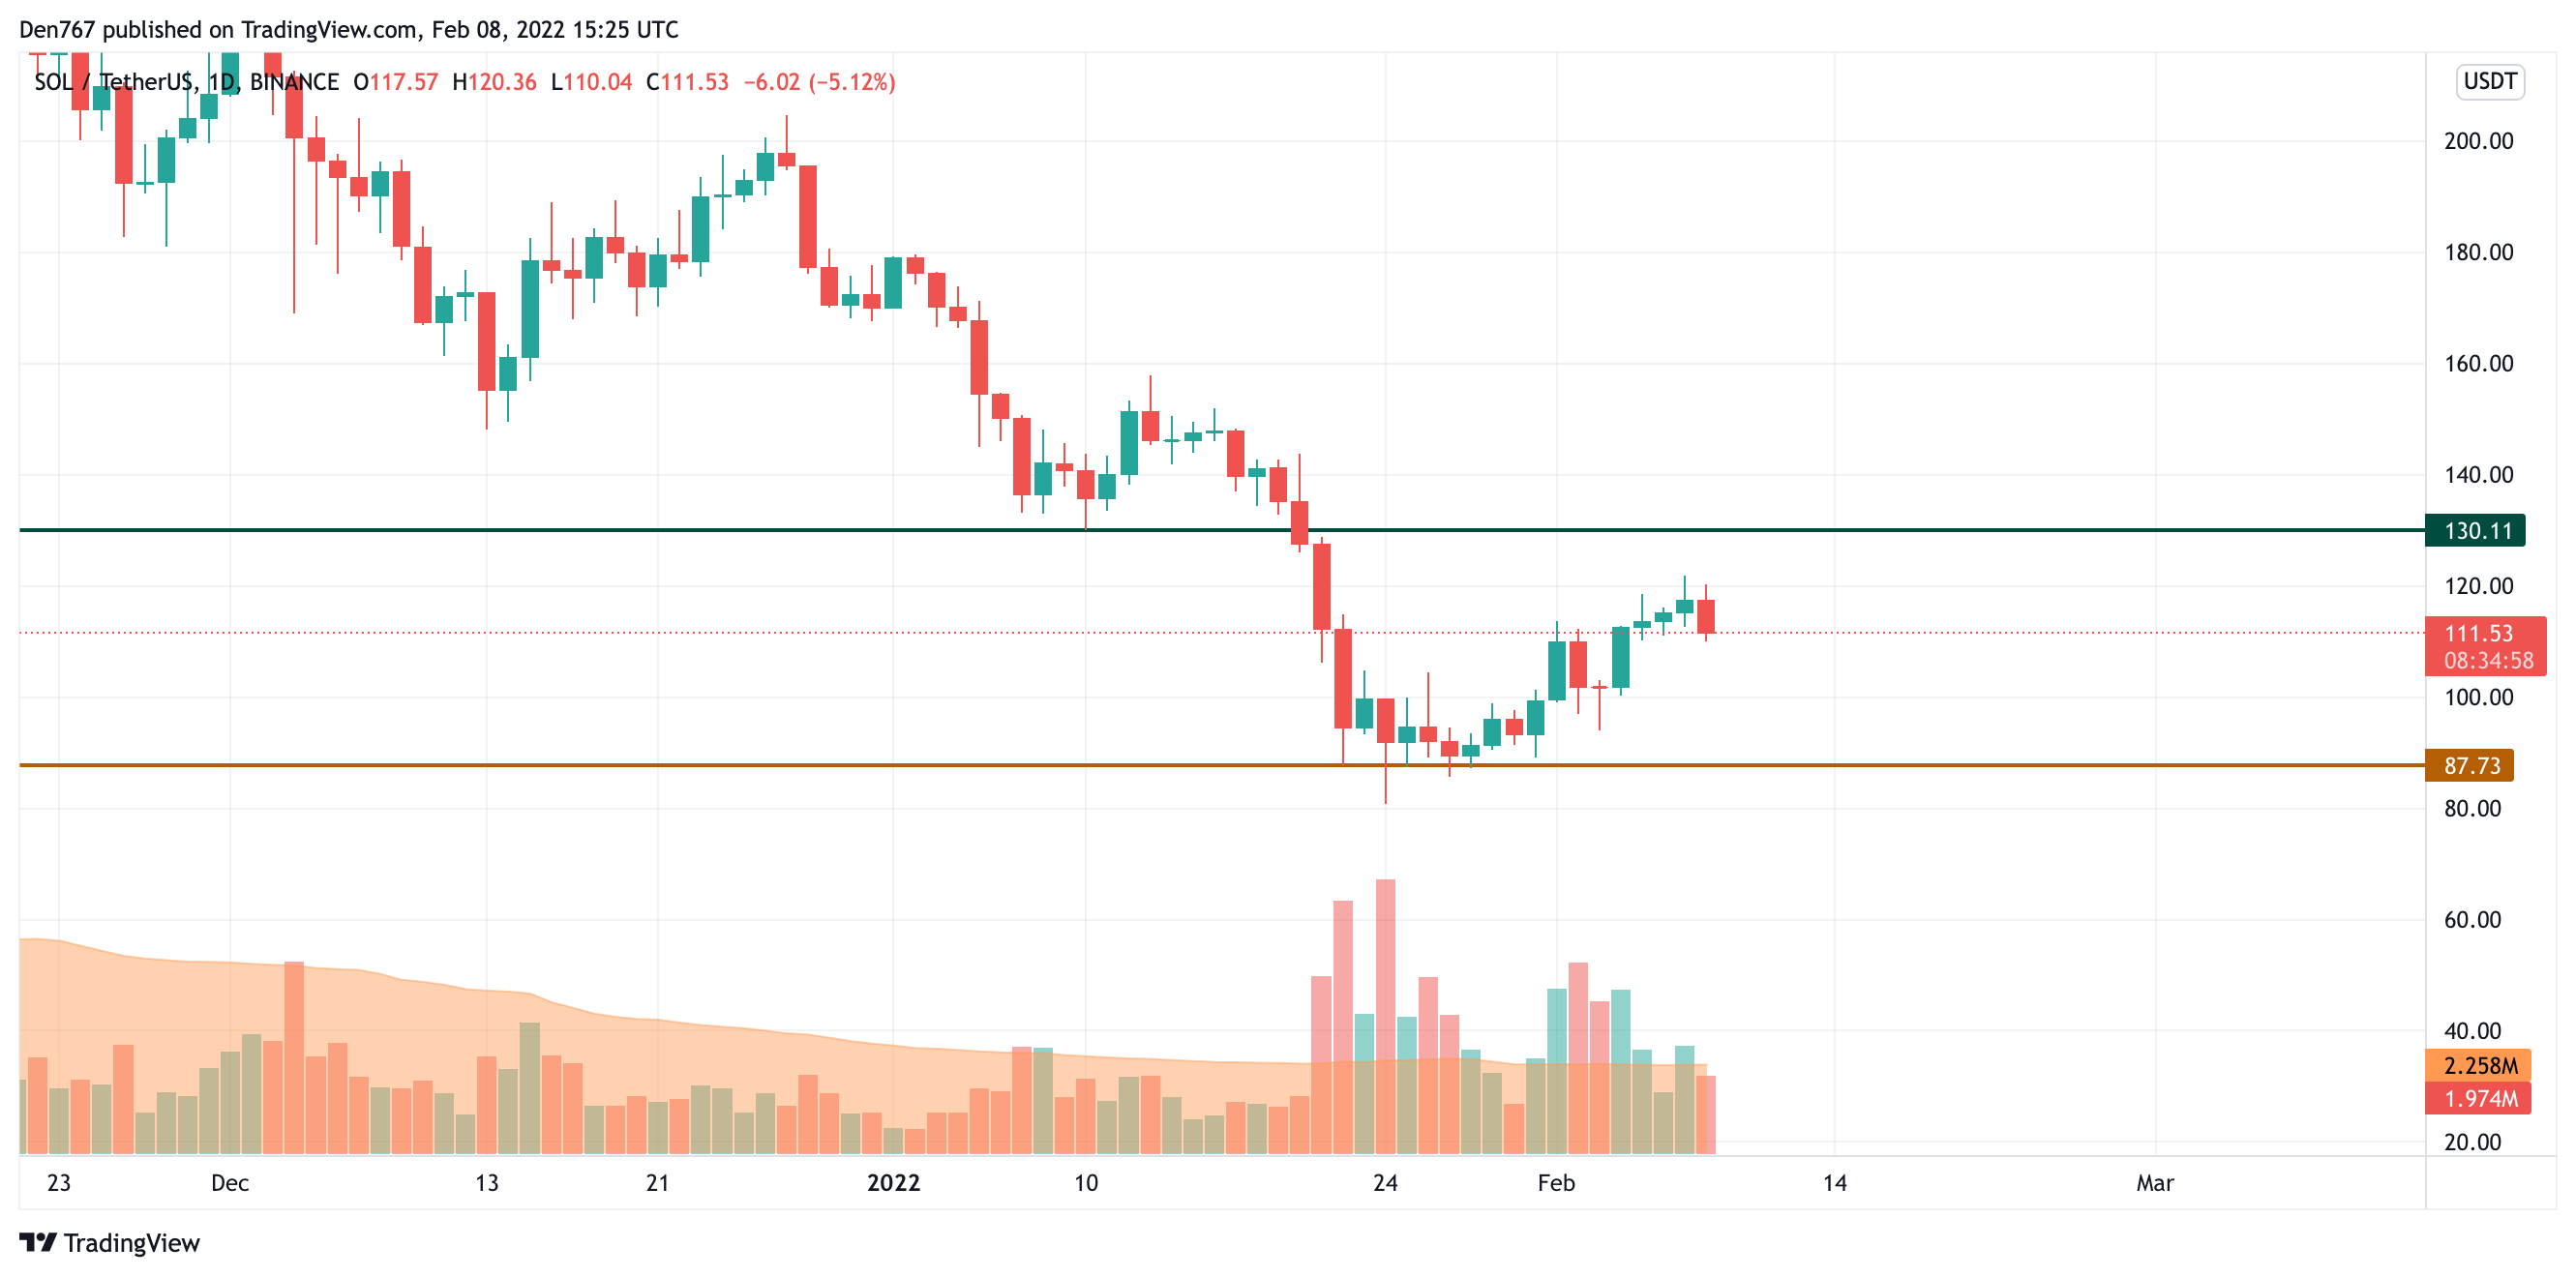
At the moment, neither bulls nor bears are dominating as the price is stuck in the channel between the support at $87.73 and the resistance at $130.11. If buyers can come close to $120 and fix above it, there is a chance to see a breakout of the $130 mark soon.
SOL is trading at $111.53 at press time.
 Dan Burgin
 U.Today Editorial Team