Disclaimer: The opinions expressed by our writers are their own and do not represent the views of U.Today. The financial and market information provided on U.Today is intended for informational purposes only. U.Today is not liable for any financial losses incurred while trading cryptocurrencies. Conduct your own research by contacting financial experts before making any investment decisions. We believe that all content is accurate as of the date of publication, but certain offers mentioned may no longer be available.
The market has entered the correction phase, at least in reference to some coins that are trading in the red zone.
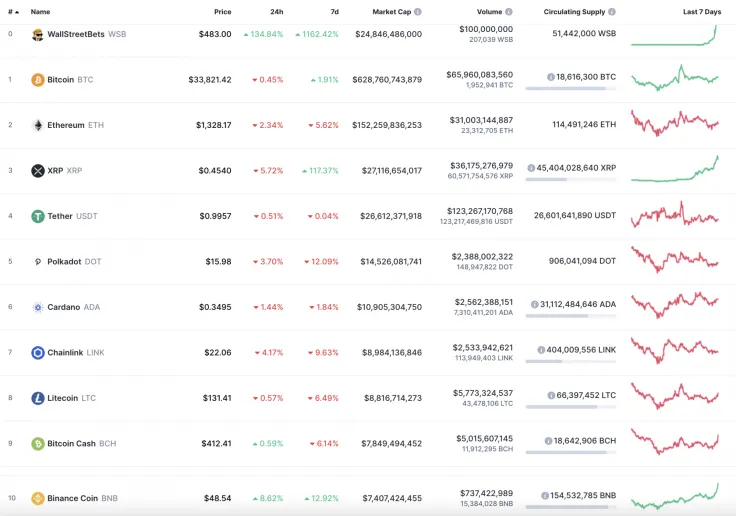
The important data for Bitcoin (BTC), Ethereum (ETH) and XRP:
|
Name |
Ticker Advertisement
|
Market Cap |
Price |
Volume (24h) Advertisement
|
Change (24h) |
|
Bitcoin |
BTC |
$628,760,743,879 | $33,638.00 | $65,960,083,560 | -1.12% |
|
Ethereum |
ETH |
$150,737,797,489 | $1,316.58 | $31,467,794,245 | -3.57% |
|
XRP |
XRP |
$18,796,901,885 | $0.4182 | $34,123,386,564 | -14.37% |
BTC/USD
Last Saturday, the 2H EMA55 paused the Bitcoin (BTC) price correction after a hyped bullish spike. The pair managed to gain a foothold above the purple downtrend line.
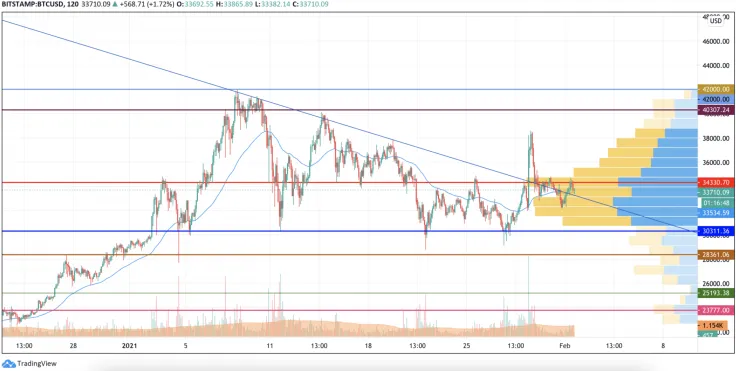
Selling volumes decreased, and bearish pressure gradually eased. However, yesterday, sellers managed to pierce the trend line and test the level of $32,200.
At the moment, the pair has recovered to the area of average prices, but this recovery was not supported by large volumes. If buyers can overcome the EMA55 moving average, then the rise may continue to the resistance of $36,000. If the volume of purchases cannot be increased, then the pair will soon roll back below the support at $32,600 and the price of BTC may return to the descending channel.
Bitcoin is trading at $33,660 at press time.
ETH/USD
On Saturday, the Ether price held above the average price level, and on Sunday, sellers managed to push through the 2H EMA55 and test the support of the trendline.
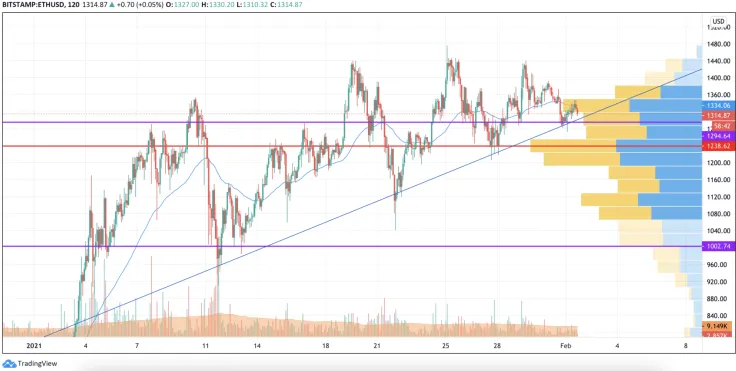
The pair is still holding in the ascending channel and, if the volume of purchases continues to grow, the price will recover above the moving average EMA55. If buyers fail to overcome the level of average prices, then bears will be able to break through the blue trend line and roll back the price to the support of $1,250.
XRP/USD
Over the weekend, the price of XRP broke through the resistance of the upper border of the side channel of $0.310 and buyers formed a powerful bullish impulse, which forced a test of the psychological level of $0.50.
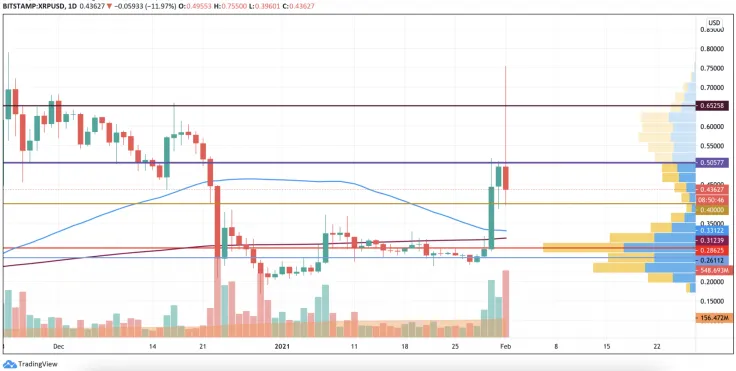
Bulls could not fix above the vital level at $0.50, which means that the accumulation phase has not ended yet. Thus, the selling trading volume is quite high.
In this case, the more likely scenario is sideways trading between $0.40 and $0.50 to get more power to keep the growth.
XRP is trading at $0.4187 at press time.
 Dan Burgin
 U.Today Editorial Team