*** Please note the analysis below is not investment advice. The views and opinions expressed here are solely those of the author and do not necessarily reflect the views of U.Today. Every investment and trading move involves risk, you should conduct your own research when making a decision.
Bitcoin is in the crucial area
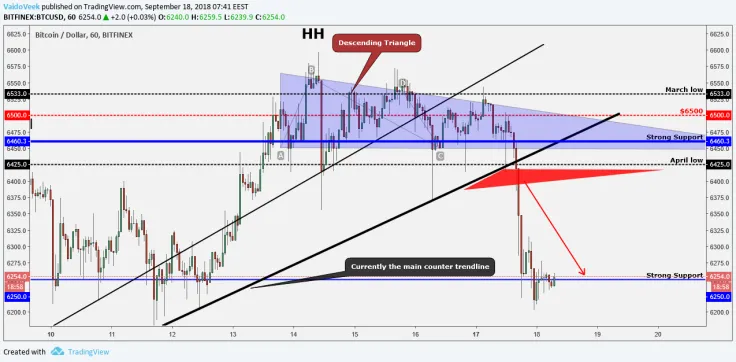
Yesterday we mentioned that Bitcoin is on the "descending triangle" and this meant that we had a slight advantage to break downwards, well it happened. On the one-hour chart, we got a breakout from the counter trendline and we got a candle close below the April low (below all important price levels between the $6,425-$6,533). Those confirmations from the one-hour chart led us to the lower levels, to the next strong support line at $6,250.

Currently, BTC price has stopped in this area and the daily candle got a close above the mentioned level. This is good because if the current level holds us then we make a higher low and the price structure stays healthy with the higher highs and higher lows.
Stellar (XLM/USD) has a superstrong area
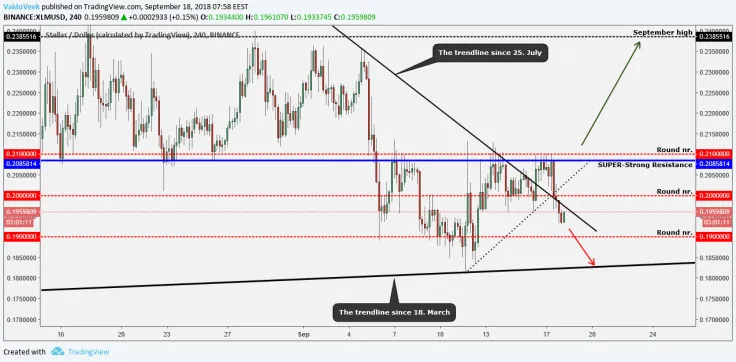
Yesterday, Stellar fought with the area which has been historically a super-strong level to beat, around $0.21. Over the two week period it has 20 (!) failed attempts to break above the mentioned levels. Previously this super-strong resistance was a support and also then we had around 20 attempts to break. So, if you want to see a bullish Stellar it has to make a breakout above the blue line.

Currently, after the little drop, we are below the round number $0.2 and back below the trendline which is pulled from July 25th.
If BTC doesn't find the bottom from the current level ($6,250) then definitely Stellar will follow that move down and we will retest the lower levels because we had a bullish "ascending triangle" pattern. However, sadly, we made a breakout downwards.
Our nearest support lines would be the double bottom around $0.18 and below is a black trendline. This trendline has pulled from March 18 and it has already three precise touches so, this is definitely a significant level. If we break below from this trendline then we may go and touch pretty low levels.
Dash (DASH/USD) shows some overall strength
Overall, Dash has shown us that it is a pretty strong coin. The drops aren't so deep and the recoveries are faster and higher than other altcoins.
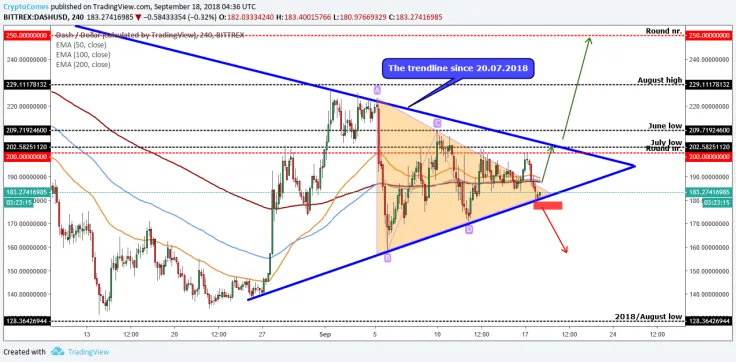
Currently, we have two triangles, one is bigger (blue trendlines) and one is smaller (orange).

Over the weekend, Dash has made a breakout from the smaller triangle and it found a resistance from the round number at $200. At the moment, it has started to make a throwback, the throwback is healthy if we find a support from the orange triangle upper trendline and from the counter trendline (lower blue line).
If the whole market starts to show us some positive signs then this retest area would be a perfect spot to invest into dash but watch out for what BTC' does because the current market situation is a bit risky and we could see a panic if the current level doesn't hold.
If the bounce happens again, then we go to the round number level and overall this is a pretty strong level to beat. Why? Because:
- $200 round number works as a resistance
- July low works as a resistance
- The trendline since July 20, 2018 works as a resistance
So, a pretty tough level but if we manage to break upwards then the triangle pattern shows us that the next nearest target would be the next 'round number' of $250 and definitely we can reach there because Dash has shown almost incredible strength compared to other top altcoins!
To give you a bearish view, it is simple- at least a four-hour candle close below both triangles will guide us to the lower levels, so watch out if the price reaches into the red box area (around $175-$180).
If we get a close around the red box then we might see a pretty heavy drop (delayed drop from Dash) because, the price is at pretty high levels compared to other altcoins, far away from the 2018 low point.
 Vladislav Sopov
 Dan Burgin