Disclaimer: The opinions expressed by our writers are their own and do not represent the views of U.Today. The financial and market information provided on U.Today is intended for informational purposes only. U.Today is not liable for any financial losses incurred while trading cryptocurrencies. Conduct your own research by contacting financial experts before making any investment decisions. We believe that all content is accurate as of the date of publication, but certain offers mentioned may no longer be available.
Shiba Inu's ecosystem token BONE may be poised for a remarkable resurgence, with signs pointing to a potential 160% increase from its current price of $0.77 per token.
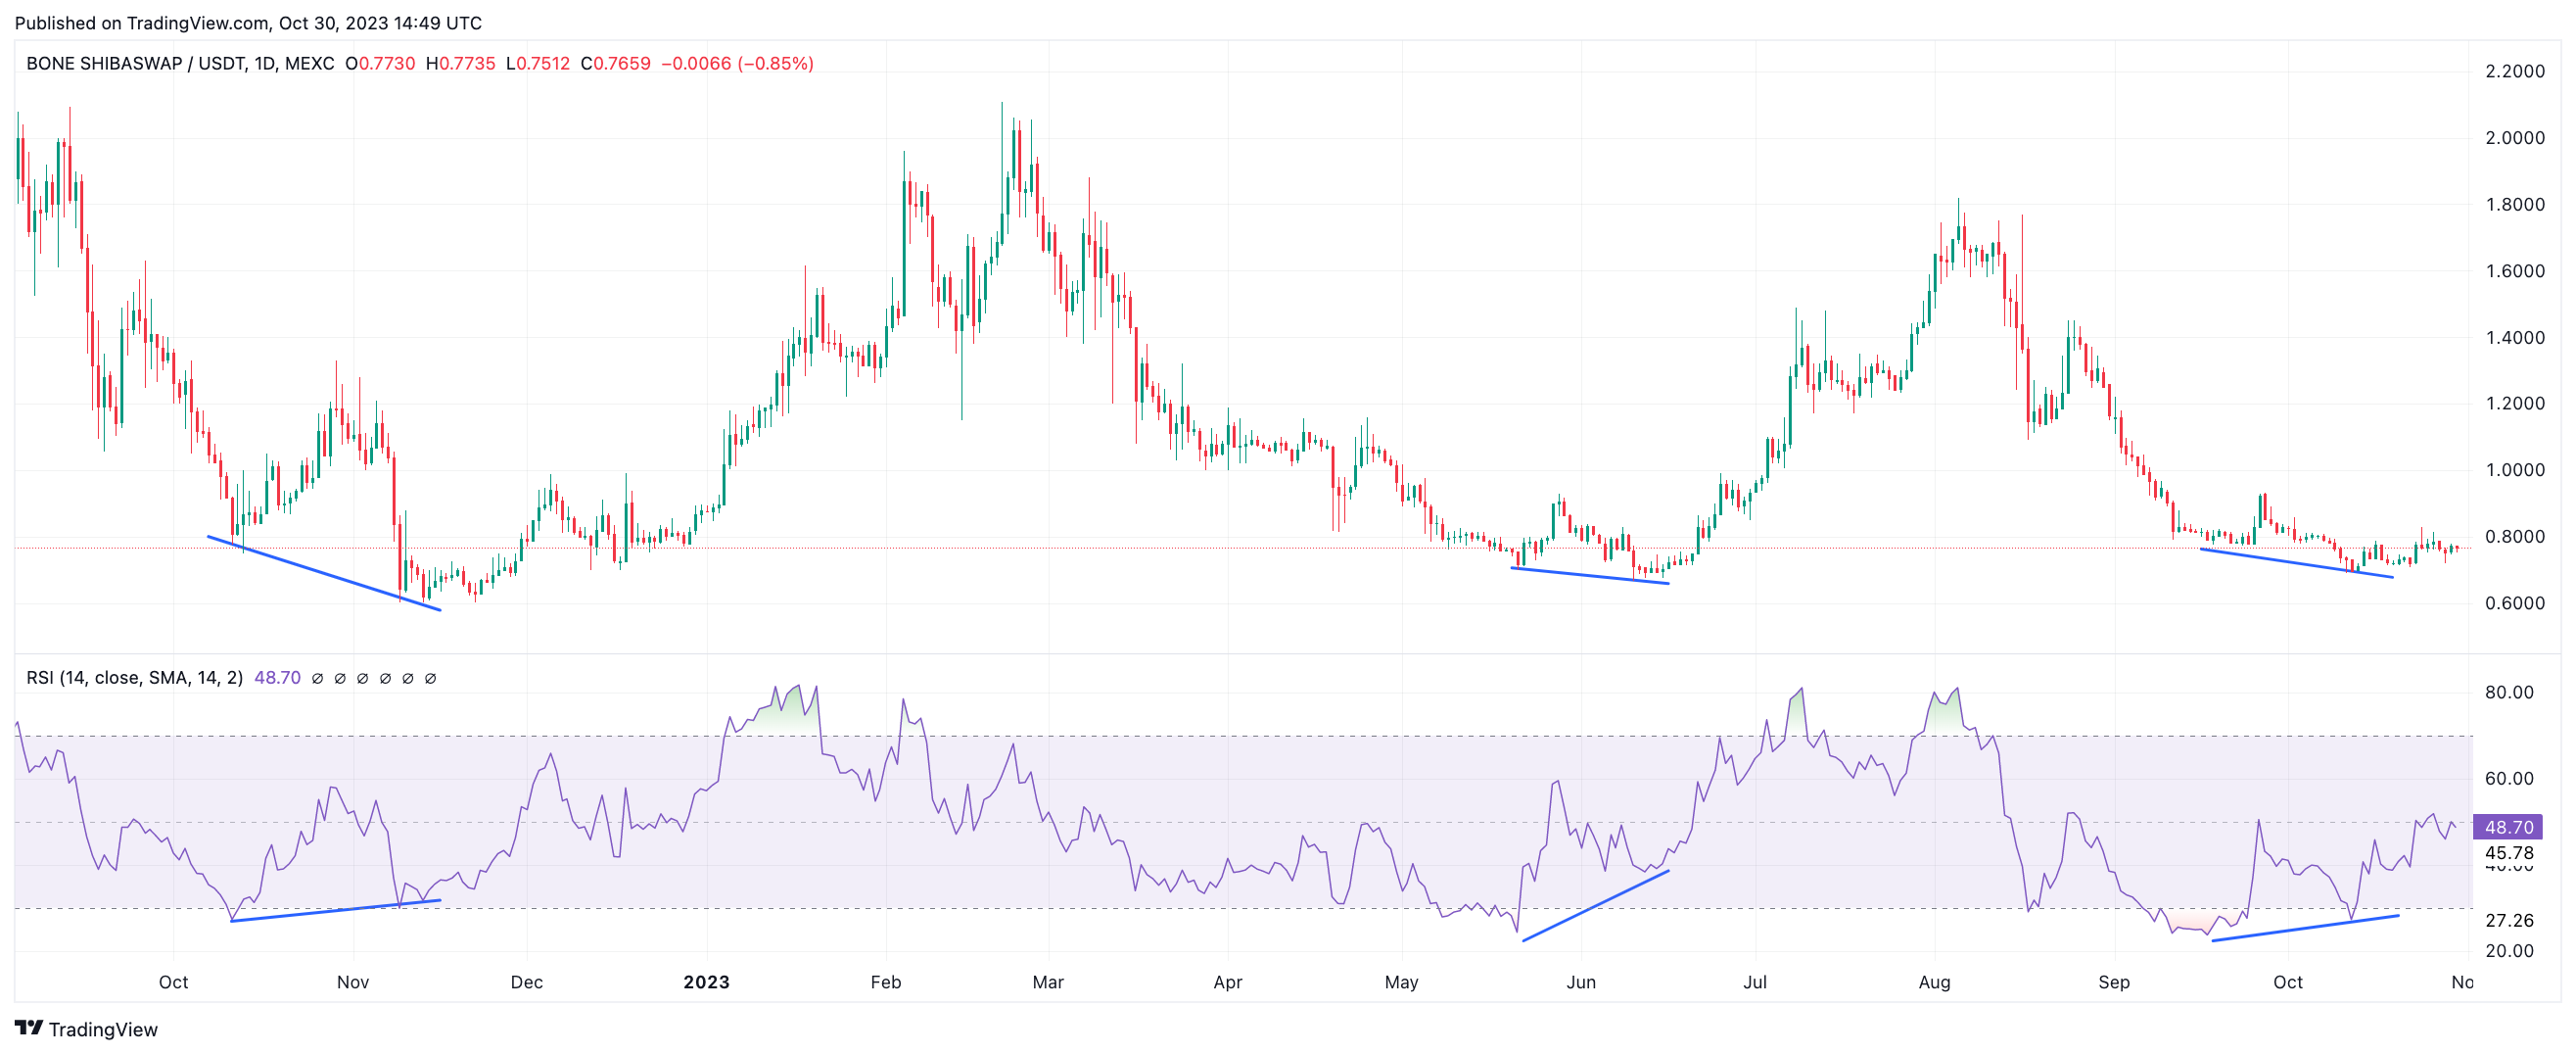
The optimism surrounding this projection stems from a pattern observed on the BONE price chart, where historical data has consistently shown remarkable growth when the token hovers around the $0.7 mark.
Looking at the historical price chart, the current price level emerges as a significant support level for BONE, a level it has consistently bounced off of and held firm in the past. Notably, the last time the token touched this price range, a stunning 160% surge ensued, spanning two months from June to July.

That rally was not a one-off event; it mirrors a similar historical precedent set just a year ago. In November of the previous year, BONE exhibited a comparable pattern, skyrocketing from its current price level to $1.9 per token.
This demonstrates a recurring trend: whenever this Shiba Inu token has traded at this price point in the past, it has consistently witnessed substantial price growth in subsequent months.
Bullish divergence
Supporting this forecast is the bullish divergence on the Relative Strength Index (RSI) chart, which has been consistently in effect for the last two months.
This bullish divergence between the token price and RSI has previously preceded significant price surges, and it is noteworthy that this is the third occurrence of such a pattern on the BONE price chart.
While history and price charts alone are not infallible indicators of future performance, they provide valuable benchmarks for understanding potential future movements. As Shiba Inu's BONE aims for 160% growth, traders should certainly pay attention to this compelling pattern.


 Alex Dovbnya
 Arman Shirinyan
 Dan Burgin