With Bitcoin staying at around $5,200, we wonder whether it will continue growing, or if there’s a pullback around the corner. Traders are guessing whether they still have a chance to enter the market, or it’s better to wait for a retracement. Let’s see what TradingView users think about it, and read their Bitcoin price predictions.
BTC is set for a pullback

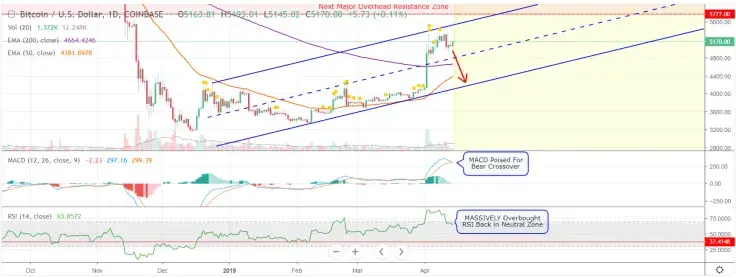
Looking at the daily chart, we can see that BTC’s price is clearly in a large uptrend channel (in blue). This channel has two clear reactions on the top trendline, and two clear reactions on the bottom trendline. Additionally, we can see that the midline of the channel (dashed blue trendline) has been reactive in the past as well. So, this is a clearly defined uptrend channel.
BTC was recently rejected at the top of the channel. Does that mean that we will now fall directly to the bottom of the channel? Well, it's possible. However, there are several significant support levels on the way down, and any one of them could be held. Those support levels are the 200 EMA (in purple,) the 50 EMA (in orange) and the midline of the channel. There are other moving averages passing through this channel as well, but those are the big ones. Interestingly, 200 and 50 EMA appear to be setting up for a golden cross. If we do happen to get a golden cross in the next few weeks, that will be a serious indication that the bear market is complete, and that we are in a transition phase into the next bull market.
As for transition phases, there’s no technical confirmation of that yet. That will be the beginning stage of the next bull market later this year. Ideally, BTC should return to the bottom of the channel, but that isn't guaranteed. Anyone of the aforementioned support levels could hold. So, pick your buy levels carefully.
Looking at the MACD, we can see that it's just now starting to cross over bearish, and the RSI has just dipped back into the neutral zone, after being severely overbought. If the price continues to fall, you should buy BTC when the RSI reaches the red horizontal trendline.
In the short term, we are likely to see the price return to the $4,000s, and possibly all the way down to the $4,300 area, which would be near the bottom of the uptrend channel. Stay on guard, because we're pulling back after making contact with the top of the uptrend channel.
BTC is going through ABC correction

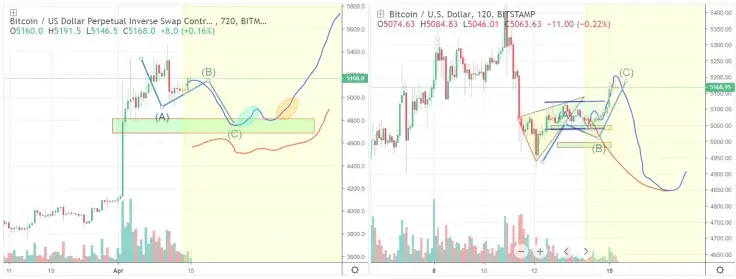
Botje11 expected BTC to touch the $4,800 level and get back to $5,200 to finish the ABC pattern. Instead, it went up a little bit more and turned into what seems to be a bearish wedge. The volume picture of the wedge seems to be correct as well, but the past half day, it just doesn't want to drop. A drop to $4,900, could become a double bottom.
That green support on the right around $5,030/50 has supported Bitcoin's price several times now. Thus, the longer it stays above it, the bigger the chance to see it move up from here. The $5,120 seems to be a solid resistance now as well, so the channel with the $5,030/5,120 range seems to be legit. A break of these levels should show some follow-through of another 90 points (difference of the range).
Ideally, we can see Bitcoin hit $5,200 and then dump again towards $4,800. In the green zone, we want to see Bitcoin find some good support with a few small bounces and then see it slowly turn up again. In this scenario, we want to see volume move into a certain shape as well. The red line is like an indication of how it should move. So after seeing some successful support around $4,800, we can see the volume drop, and then if we see it bounce up a bit, the volume will increase a bit. Then it will drop a little and then see price move up more and volume slowly increasing as well. The volume increases don't have to be big, but they really need to happen, extremely important.
A break of $5,200/5,300 should show a big volume increase. If we see something like that, we could really see another big rally happen coming weeks. It is very unlikely to assume the rally is already over. Of course, anything can happen, but the chances are around 20%. A break of $4,800 would like to increase that to 40%.
It's hard to say what the potential is. The possible targets are $5,900/6,500/6,900. But these are a bit subjective but worth having them prepared. After its short bearish period, BTC should at least reach like $5,600/5,800. A lot will depend on how strong the breakout would be when breaking $5,200/5,400.
BTC will test $4,600 support

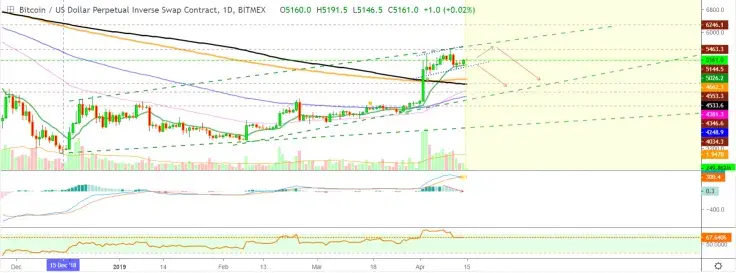
Bitcoin has found support at the same level marked by the Exponential Moving Average of 10 periods, which is marked with a green line on this chart (EMA10). We know that the bullish potential remains as long as we trade above EMA10, but a break and close below it can easily send Bitcoin to test lower support levels.
We have the MACD clearly moving in favor of the bears. The upcoming bearish crossover is almost here, and the histogram moving lower. Consolidation above EMA10 can lead to one last impulse to the upside, but this is the less likely scenario at this point.
A break below this support level and we can see Bitcoin testing $4,660 quickly, which is marked by EMA200. Expect the entire market to retrace some more before any strong bullish action can be fully resumed. The dashed lines on the chart, either above or below current price (light green), mark the most relevant resistance and support levels on this time frame.
 Tomiwabold Olajide
 Caroline Amosun