
Disclaimer: The opinions expressed by our writers are their own and do not represent the views of U.Today. The financial and market information provided on U.Today is intended for informational purposes only. U.Today is not liable for any financial losses incurred while trading cryptocurrencies. Conduct your own research by contacting financial experts before making any investment decisions. We believe that all content is accurate as of the date of publication, but certain offers mentioned may no longer be available.
Bitcoin has formed a quite rare technical pattern on the daily chart of the cryptocurrency that might act as a point of global reversal of the market. The "Reversed Head and Shoulders" pattern usually appears at the bottom of a bearish rally.
How may the pattern change the shape of the market?
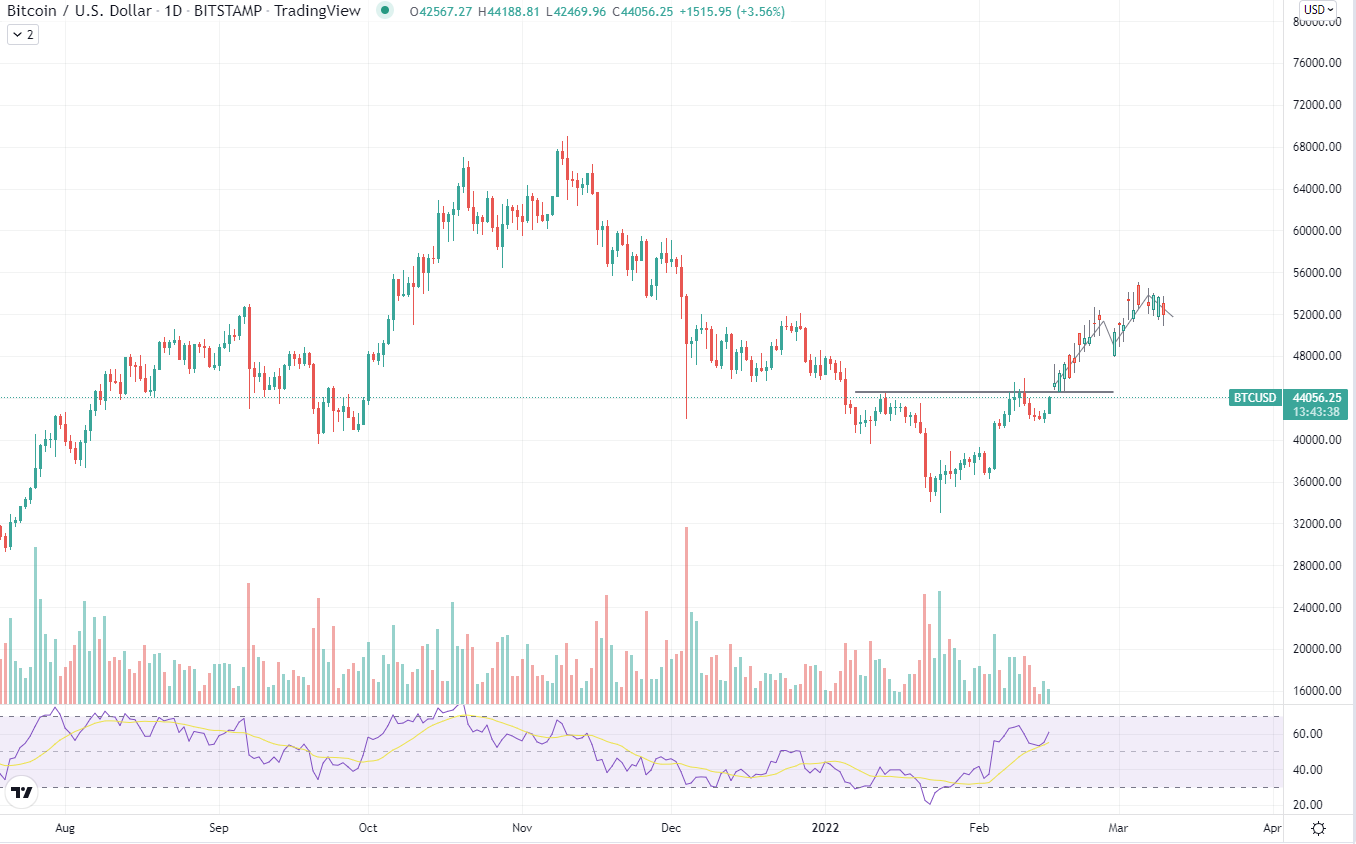
According to Bloomberg's analysis, the pattern that appeared on the chart could mark the future path for the world's largest cryptocurrency to new local highs. As the analysis suggests, the potential target for Bitcoin could be set at $53,000. If the cryptocurrency finally manages to break the neckline resistance, this scenario would come into play.
The 18% price increase would be considered a bold move for Bitcoin, which has been in a correction state for the last 100 days. Such a strong spike up would put the current reversal's price increase to approximately 53%.
While reaching $53,000 could be considered a full reversal and exit from the correction, Bitcoin would still be trading 20% cheaper compared to its all-time high of $69,000.
How likely is the neckline break?
While there is no way to be certain if Bitcoin is going to break through the abovementioned resistance line, we could still compare the technical data with the help of indicators like RSI and volume.
According to open interest, investors are not rushing to put their funds back to the market; hence, trading volumes are still considered lower than before, which is not a good sign for the crypto market.
As for the relative strength index, the values of the indicator are currently staying in the neutral zone, suggesting that the market has room for growth.
 Dan Burgin
 U.Today Editorial Team