Disclaimer: The opinions expressed by our writers are their own and do not represent the views of U.Today. The financial and market information provided on U.Today is intended for informational purposes only. U.Today is not liable for any financial losses incurred while trading cryptocurrencies. Conduct your own research by contacting financial experts before making any investment decisions. We believe that all content is accurate as of the date of publication, but certain offers mentioned may no longer be available.
The weekend has begun with continued bullish dominance; however, some coins are in the red zone.
BTC/USD
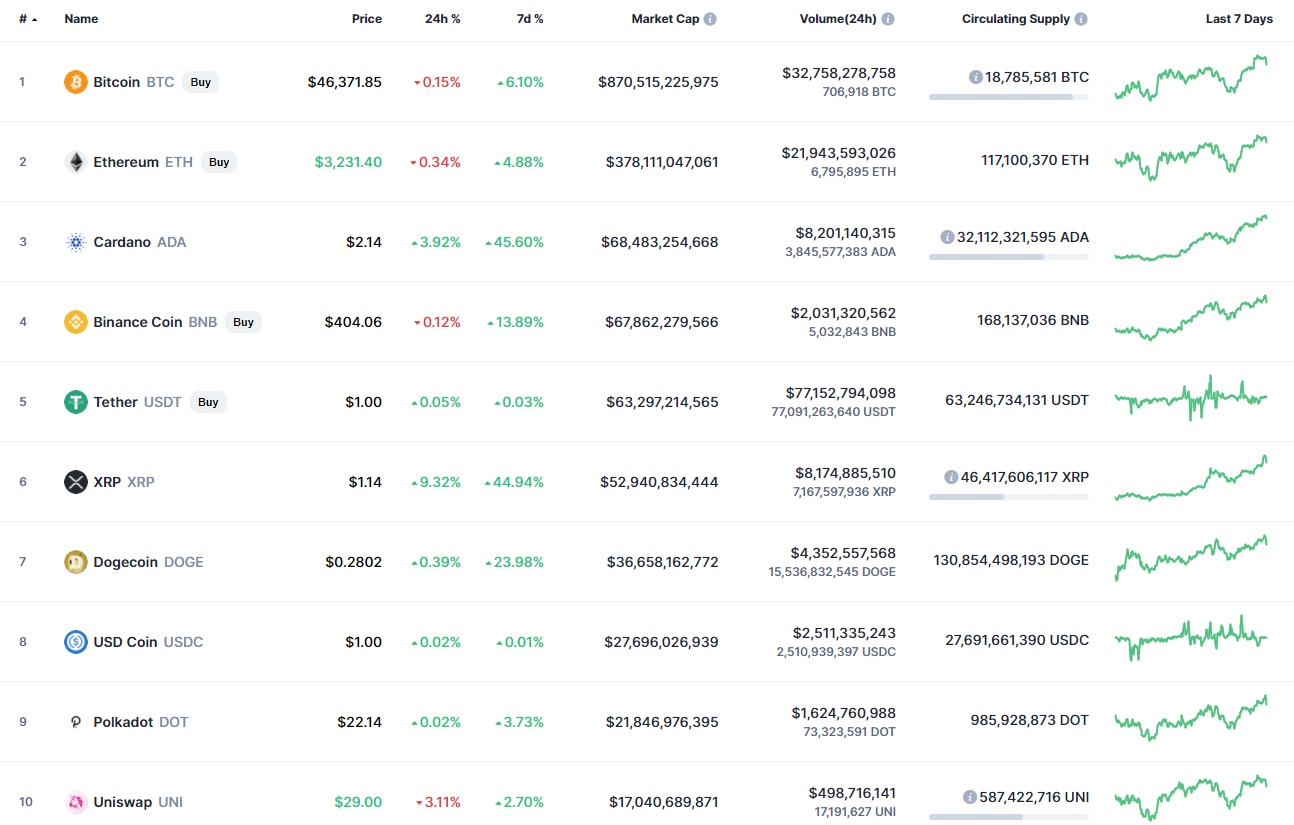
Bitcoin (BTC) could not follow the rise of the altcoins, and its rate has declined by 0.22% since yesterday, while the price change over the past seven days has been 5.95%.
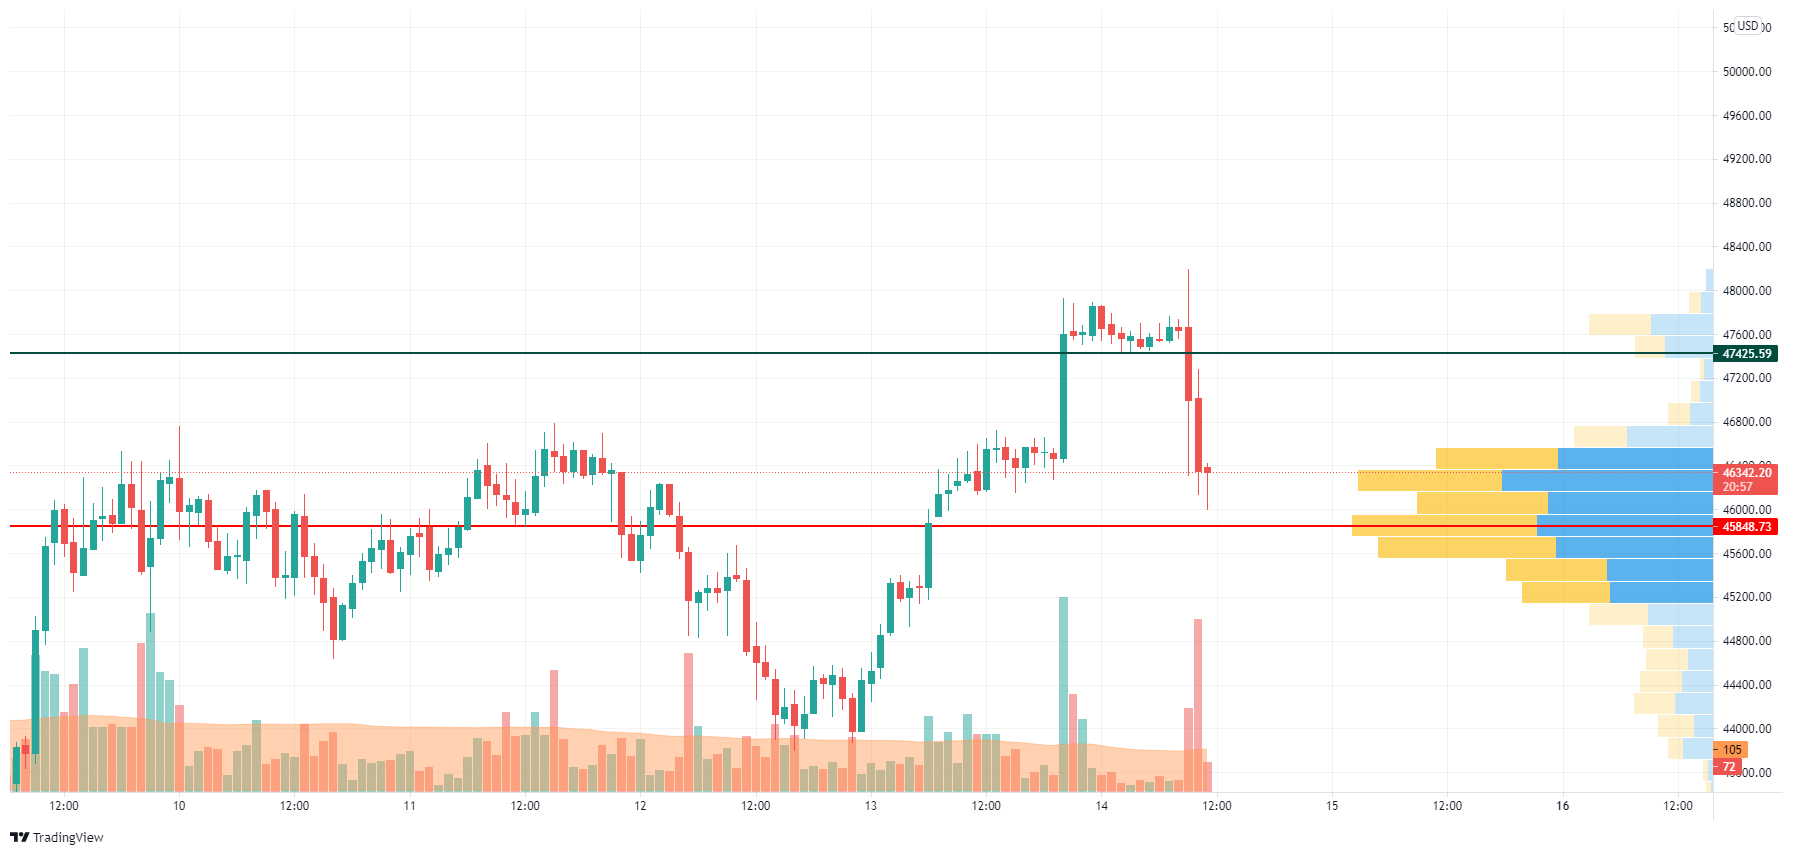
On the hourly chart, Bitcoin (BTC) has almost reached the liquidity zone at around $45,900 where a bounceback has occurred. The decline was accompanied by a high selling trading volume, which means that bears may not have closed their positions yet.

In this case, the more likely price action until the end of the day is a retest of the mirror level at $47,400.
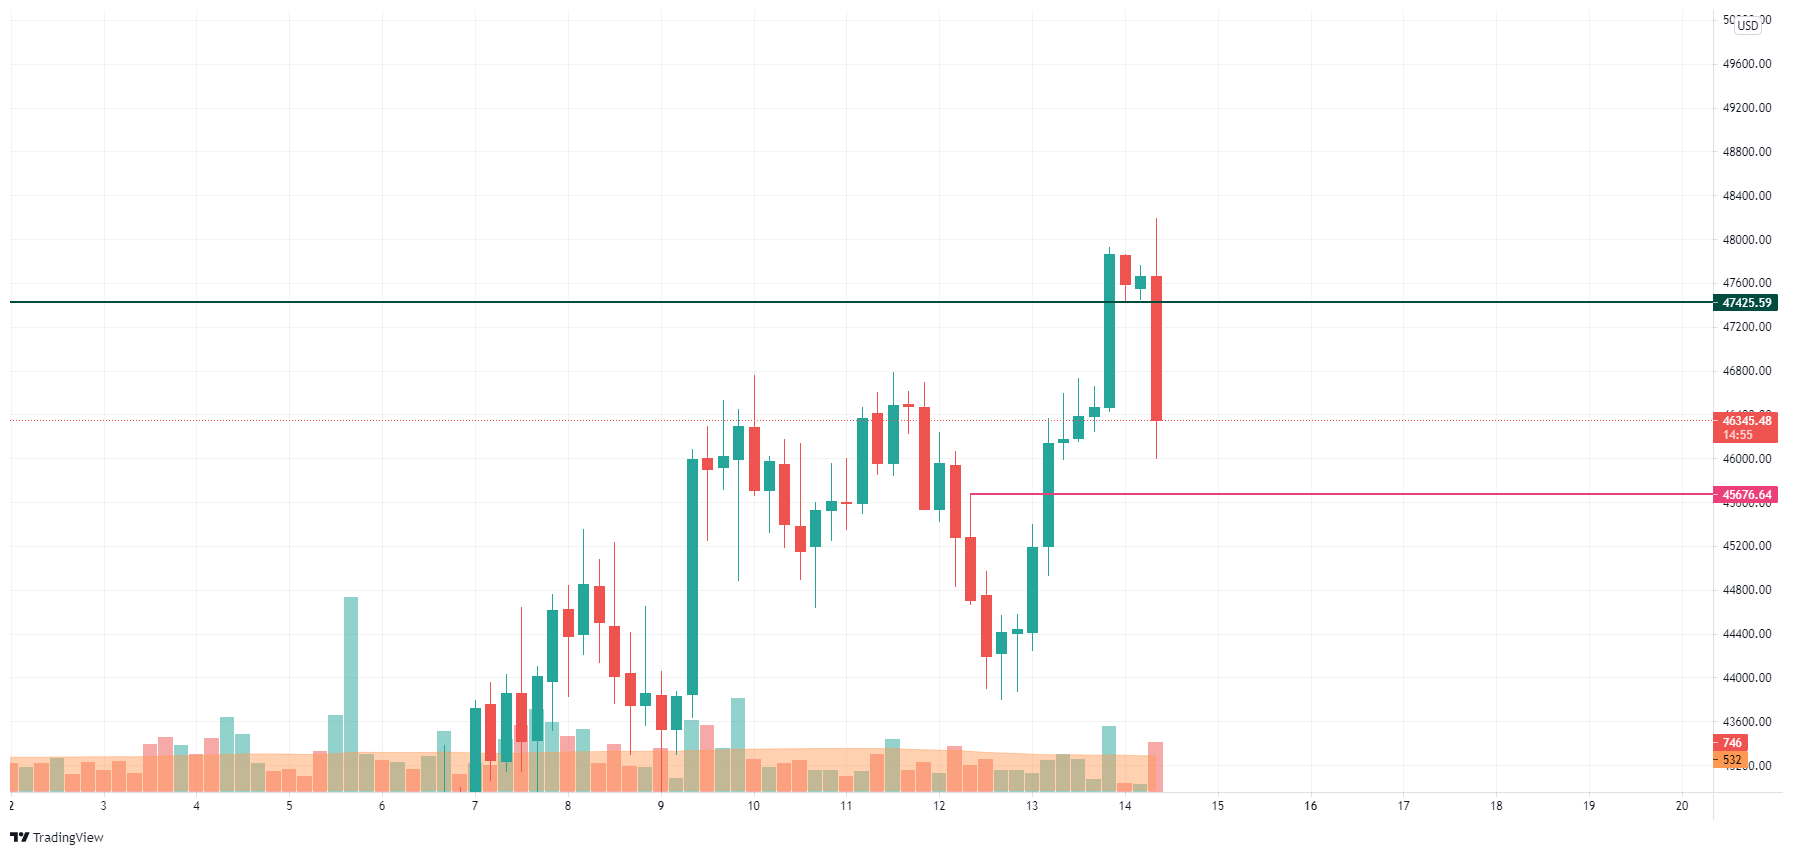
On the longer time frame, the decline may continue if bears fix below the $46,500 mark until the end of the trading session. Respectively, the nearest level at which bulls may try to seize the initiative is the support at $45,676.
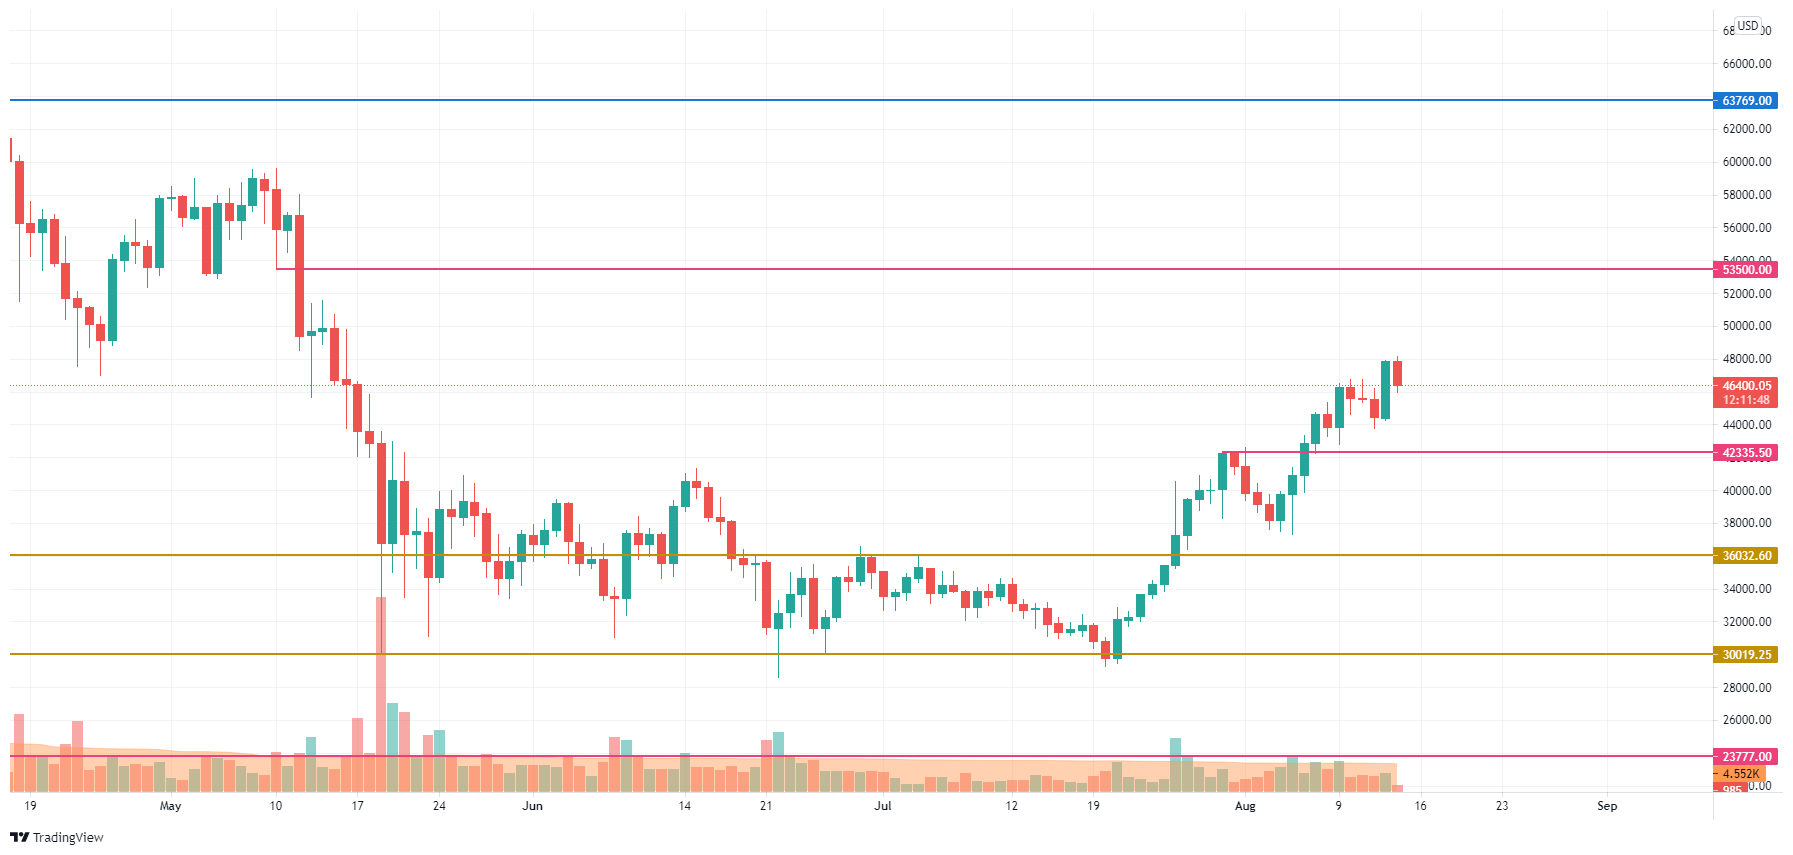
In the mid-term, the long-term scenario remains relevant. The trading volume has declined slightly, which might mean that traders are gathering power to keep the rise going. All in all, the level of $53,000 can work for buyers until the end of the month. However, if bears fix below $42,300 on the daily chart, the decline will be more likely to happen.
Bitcoin is trading at $46,421 at press time.
 U.Today Editorial Team
 Dan Burgin