
For the last 3 years, the month of December has been prolific for the world’s largest digital asset (BTC), which posted gains of 14%, 30%, and 40% in 2015, 2016 and 2017, respectively. That “winning streak” might snap this December, considering that Bitcoin and the crypto market, in general, have been tanking heavily during the last period.
Chart Analysis – BTC/USD
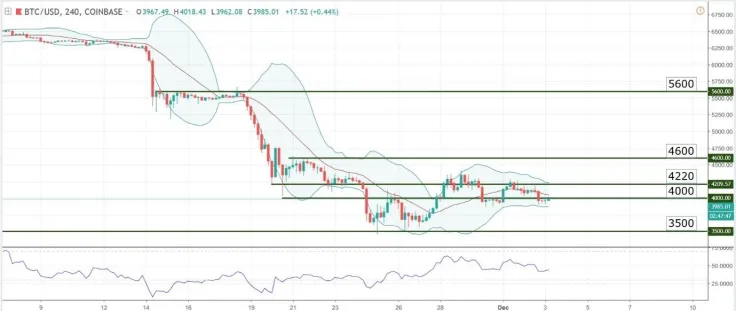
Currently, Bitcoin is trading right on the $4,000 level, with a 2.44% loss over the last 24 hours and a 3.44% gain for the last 7 days, but it must be noted that it failed twice to break resistance and the Bollinger Bands are curving downwards once again. The Relative Strength Index has started to move lower as well, and all this points to another possible drop that may have 3500 as a target.
The picture remains relatively blurry, and for the time being there is no clear indication whether the current price action is part of a simple correction in a downtrend or if we are dealing with a possible end to this bearish trend.
Support zone: 4000 area
Resistance zone: 4200 - 4400
Most likely scenario: downtrend resumption if price stays below 4200
Alternate scenario: bullish break of resistance zone and move into 4600
 U.Today Editorial Team
 Dan Burgin