

Disclaimer: The opinions expressed by our writers are their own and do not represent the views of U.Today. The financial and market information provided on U.Today is intended for informational purposes only. U.Today is not liable for any financial losses incurred while trading cryptocurrencies. Conduct your own research by contacting financial experts before making any investment decisions. We believe that all content is accurate as of the date of publication, but certain offers mentioned may no longer be available.
Bitcoin is currently on the brink of dropping below the $60,000 level, a significant psychological and technical level for the cryptocurrency. As observed on the chart, a descending trendline is clearly applying downward pressure, guiding Bitcoin into forming lower lows. This pattern suggests that the downward momentum might continue in the near term.
The current market dynamics show Bitcoin's price being squeezed by this descending trendline. Every attempt to push upwards meets resistance, leading to lower highs — a classic indicator of a continuing downtrend. Notably, the volume of trades has been decreasing, which typically indicates a weakening of the current trend and potentially sets the stage for a trend reversal. However, the current signals suggest that the market is not yet ready to reverse to being bullish.
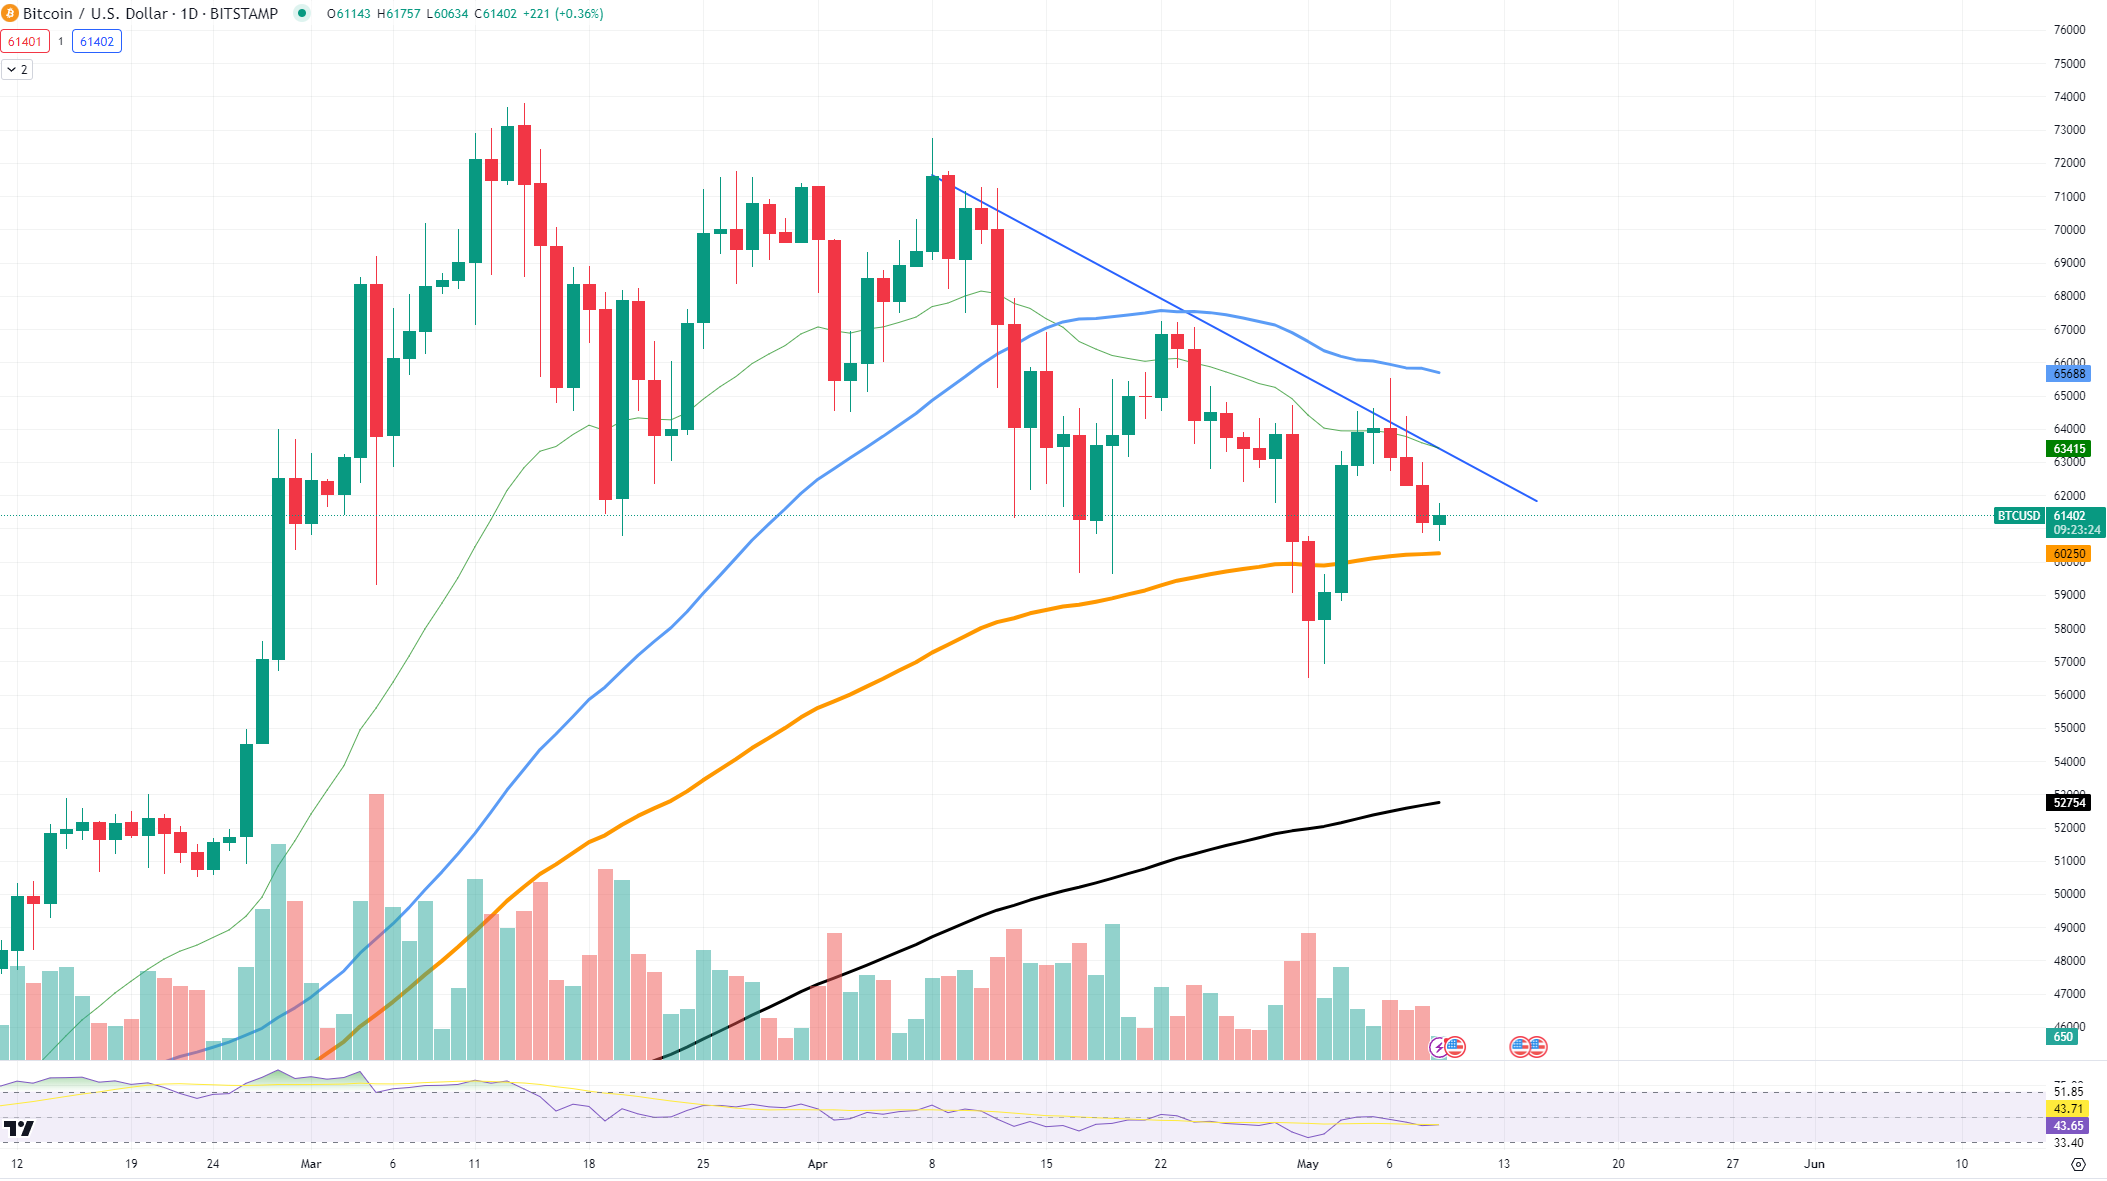
Adding to the complexity of the movements is the potential formation of a higher low, which could be the first sign of an impending shift in trend. This is a critical observation as it could signify that although the overarching trend is bearish, there is some buying interest at lower levels that prevents further drops, providing a temporary floor for Bitcoin's price.
The immediate future of Bitcoin's price largely depends on its interaction with the trendline and key moving averages. Currently, the 50-day Exponential Moving Average (EMA) sits around $65,000, acting as potential upper resistance in case of any bullish reversal.
Shiba Inu hits threshold
Shiba Inu is currently navigating a critical phase as it hovers around a strong support level at approximately 0.00002260.
The current chart formation presents a descending triangle pattern, a typical bearish signal in technical analysis, suggesting that SHIB could be under significant selling pressure. This pattern is forming just as SHIB tests its support, making the 0.00002260 level crucial for determining its short-term trajectory. A break below this could lead to a test of the next major support at the 0.00002100 level, aligning closely with the 100-day EMA. It often acts as a dynamic support in downtrends, providing a potential rebound zone for the price.

 Mushumir Butt
Conversely, the immediate resistance is located around 0.00002400. Overcoming this level could invalidate the bearish pattern and possibly trigger a short-term bullish reversal. However, the convergence of the EMAs above this price point may complicate any upward movements, potentially capping gains and adding to the volatility.
Given these dynamics, the situation with Shiba Inu remains highly uncertain. The descending triangle, combined with the convergence of moving averages and key support and resistance levels, suggests that SHIB could experience increased volatility in the near future. This unpredictability makes it a risky asset for traders and investors at this time.
Is Solana aiming at reversal?
Solana is currently showing signs of a potential reversal pattern. As it approaches the 100-day EMA we might see a reversal. However, it is important to note that this EMA has not been tested before, which brings a degree of uncertainty about its reliability as a support.
The current price movement has brought SOL closer to what might be seen as a critical juncture. The nearest solid support level is established around $128, but this level has already been breached once, adding to the unpredictability of its strength in holding future dips. Such breaches can undermine confidence in the support level, suggesting that it may not be as robust as hoped.

 Arman Shirinyan
Despite these concerns, there are positive signs in the market dynamics. The descending volume indicates that selling pressure is diminishing, which could mean that sellers are getting exhausted. This scenario typically sets the stage for buyers to regain control and potentially drive the price upwards.
However, the volume profile does not support the formation of an inverse Head and Shoulders pattern, a common bullish reversal indicator, casting some doubts on the immediacy of a bullish turnaround.
In the midterm, if buyers can capitalize on the reduced selling pressure, there is a chance for Solana to make significant gains.