Disclaimer: The opinions expressed by our writers are their own and do not represent the views of U.Today. The financial and market information provided on U.Today is intended for informational purposes only. U.Today is not liable for any financial losses incurred while trading cryptocurrencies. Conduct your own research by contacting financial experts before making any investment decisions. We believe that all content is accurate as of the date of publication, but certain offers mentioned may no longer be available.
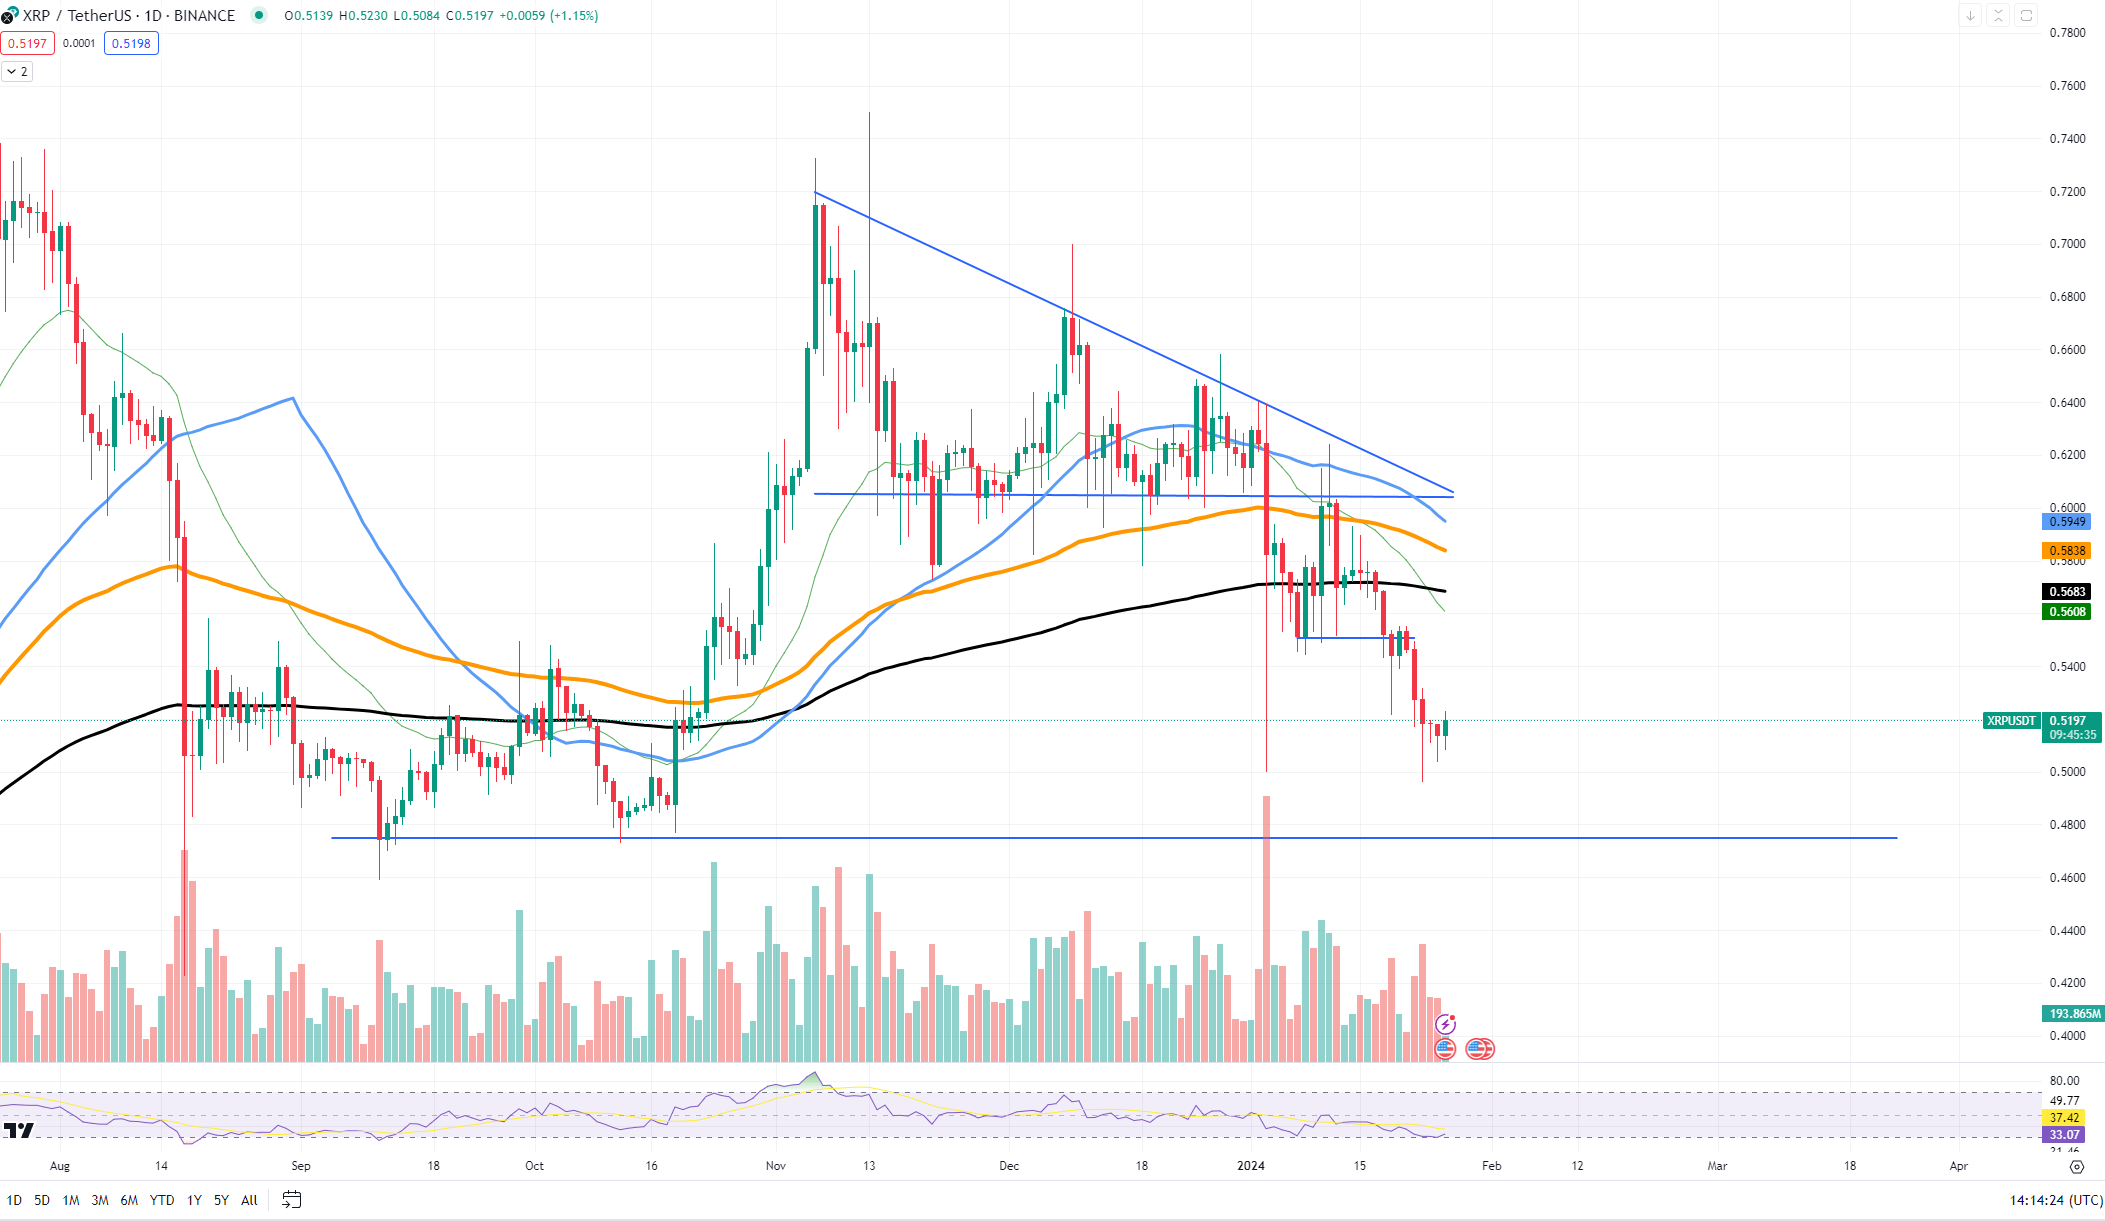
XRP appears to have begun its market movements earlier than anticipated. The chart shows a notable shift from the recent sideways trading pattern, as XRP starts to carve out a new direction.
As of the latest trends, XRP has been testing the support level around $0.50, a crucial psychological threshold for the asset. A sustained move below this level could signal further bearish momentum, potentially leading the price to test the next significant support zone around $0.47.

On the flip side, if XRP manages to stabilize and bounce back from the current support, the initial resistance is likely to be encountered near the $0.54 mark, where the 50-day moving average currently lies. This moving average has historically acted as a dynamic resistance level, and a breakout above could propel XRP toward the $0.56 level, which aligns with the 100-day moving average.
Further complicating the chart is the downward trendline that has been in play since the local high established in November. This trendline has repeatedly acted as resistance, pushing the price downward each time it has been tested. For a true reversal to be confirmed, XRP would need to break above this trendline with significant volume to validate the move.
Solana is leading pack
Solana is manifesting its strength as the top performer among the top 10 cryptocurrencies by market capitalization. Despite overall market volatility, SOL's price action has been signaling a stronger recovery compared to other assets.
At the time of analysis, Solana is trading around the $90 mark, having rebounded with considerable momentum from the support level near $78.35. This pivotal point, bolstered by the 100-day Exponential Moving Average (EMA), has served as a springboard for the recent bullish trend. The price of SOL has been consistently creating higher lows, indicative of strong buying interest at these levels.
Resistance for SOL is currently looming at the $100 psychological level, a breakthrough of which could propel the price toward the next significant resistance at $110.
The relative strength of Solana is further substantiated by the resurgence of a risk appetite on the market, particularly evidenced by the blossoming of meme coins. This renewed interest in higher-risk assets typically bodes well for ecosystems like Solana that support a variety of decentralized applications and niche crypto projects.
Ethereum needs push
The Ethereum market is currently facing a confluence of challenges as it searches for the momentum to sustain its position. A recent chart analysis reveals an indecisive atmosphere among investors, with Ethereum struggling to find a strong directional move.
At present, Ethereum is hovering around the $2,200 mark, a level that has seen significant activity and is currently acting as a temporary support. However, the lack of bullish conviction suggests that this support level may not hold if a new wave of selling pressure emerges.
Resistance levels are observed near the $2,400 range, where previous attempts to break higher have been met with a firm rejection, indicating a substantial barrier to upward movement.
The selling pressure is partly attributed to the recent news of Celsius Network liquidating approximately $1 billion worth of Ethereum holdings. This substantial amount has the potential to saturate the market, overwhelming current liquidity and triggering a downturn. As a result, the $2,000 psychological level is eyed as the next critical support zone, a breach of which could see a sharp decline toward the $1,950 region, where the 200-day moving average lies, providing stronger historical support.
On the flip side, if Ethereum can absorb the selling pressure and gain the necessary "fuel," a push above the $2,400 resistance could open the path toward the $2,500 area before challenging the more formidable resistance at $2,600, which aligns with the 50-day moving average.


 Vladislav Sopov
 Dan Burgin