Disclaimer: The opinions expressed by our writers are their own and do not represent the views of U.Today. The financial and market information provided on U.Today is intended for informational purposes only. U.Today is not liable for any financial losses incurred while trading cryptocurrencies. Conduct your own research by contacting financial experts before making any investment decisions. We believe that all content is accurate as of the date of publication, but certain offers mentioned may no longer be available.
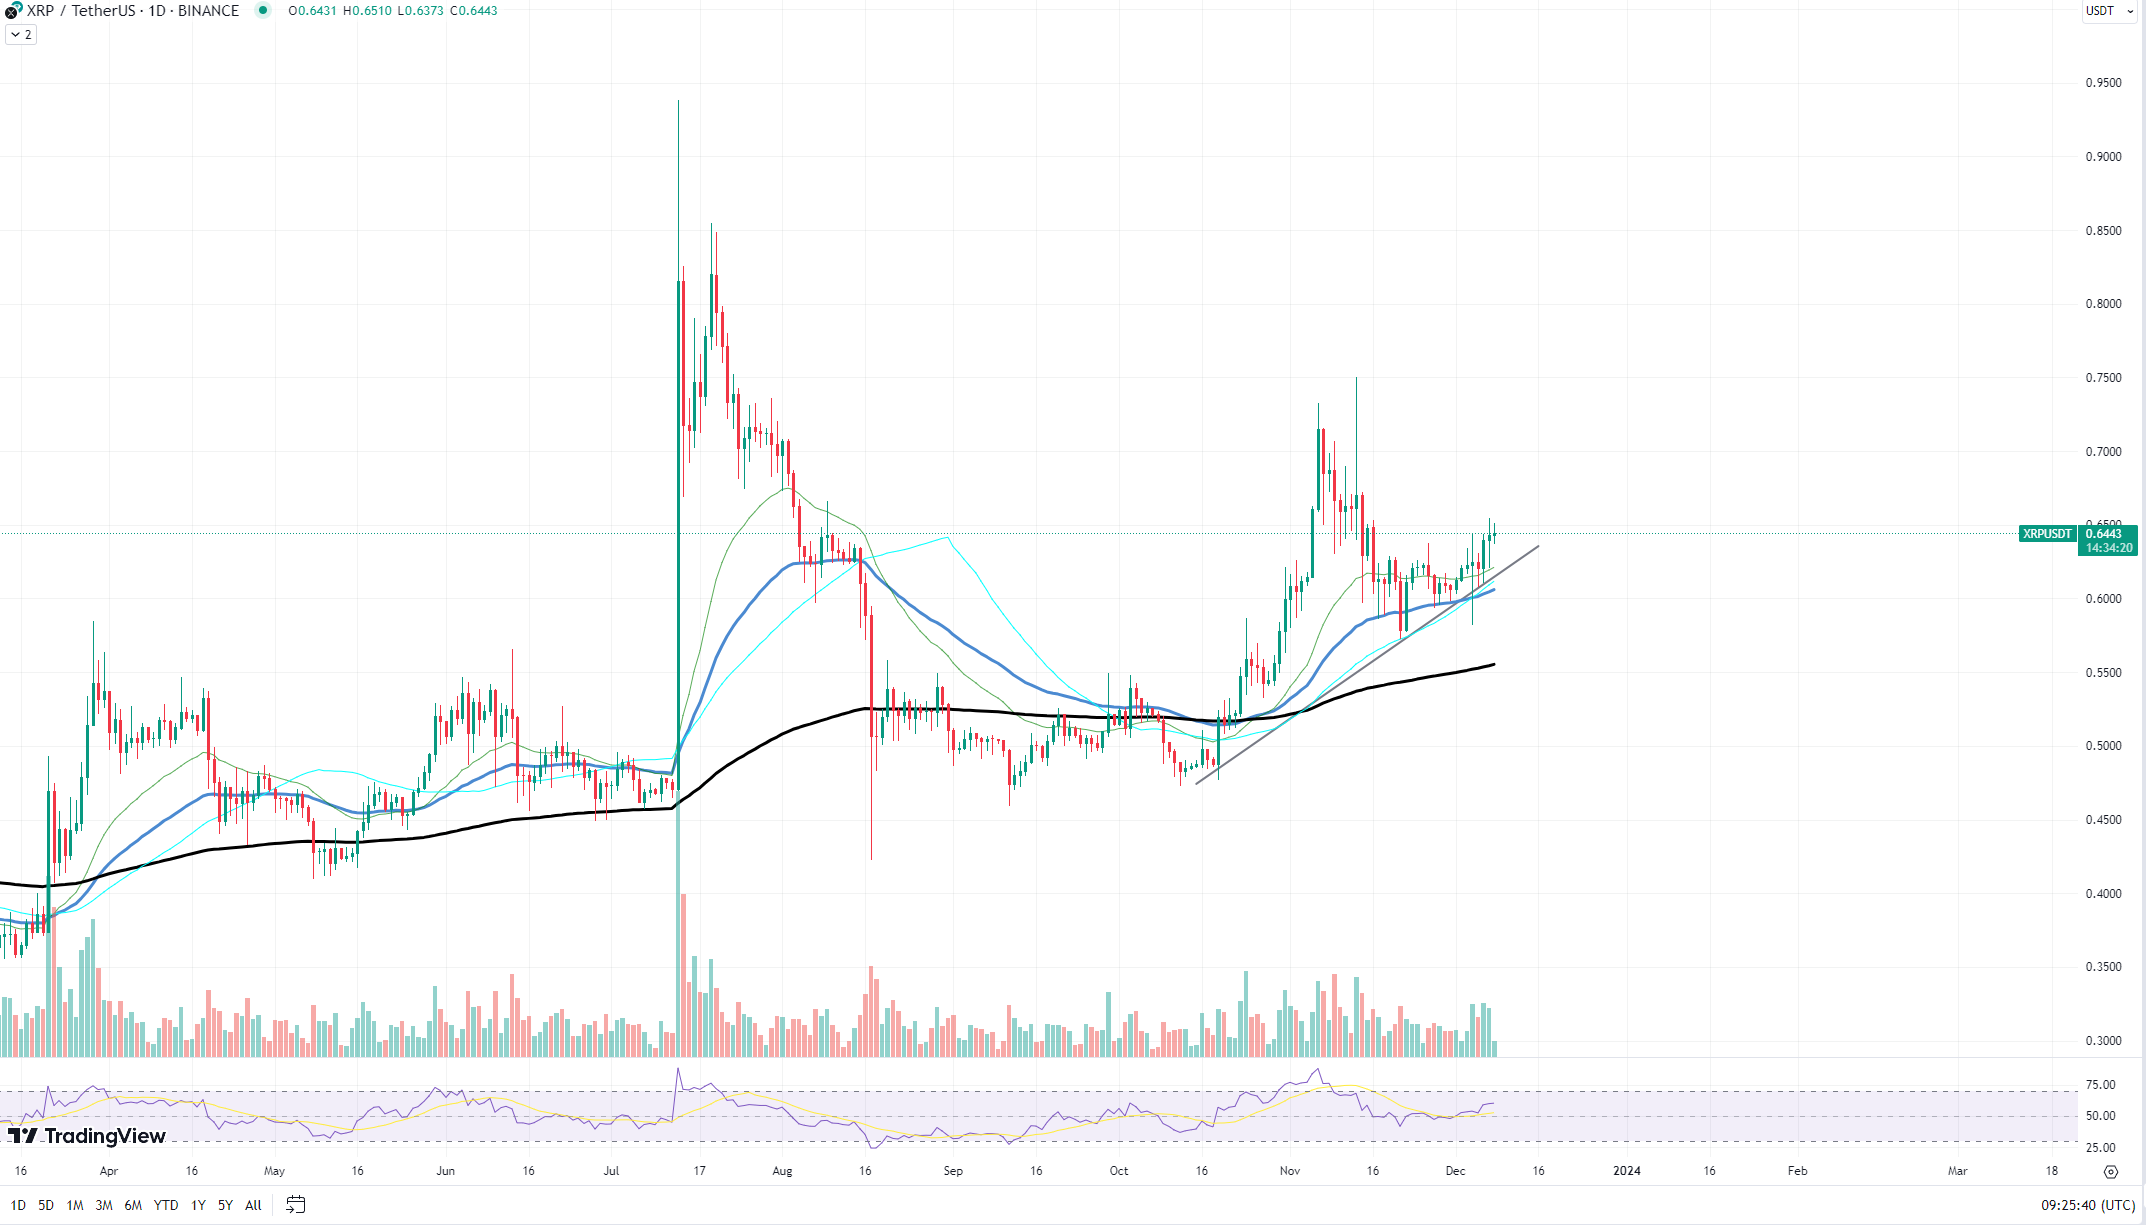
In the past few days, XRP has demonstrated resilience, with its price action signaling a steady uptrend. This ascent is charted through a series of higher lows, a positive sign for investors. The cryptocurrency has been carefully treading above a vital support level at $0.60, which has historically served as a springboard for upward movements; however, XRP bulls were unable to push the cryptocurrency's price higher.
As XRP navigates the currents of market sentiment, it faces a local resistance level at approximately $0.65. This price point has proven to be a challenging barrier to breach, with several attempts resulting in minor pullbacks. However, the resilience at the support level suggests that the bullish momentum still persists and the asset can potentially push through this resistance.

The price of $0.73 will most likely become the next major resistance level for the asset. This threshold is significant for a number of reasons. First, it represents a key psychological threshold and a price point at which XRP has previously encountered substantial selling volume.
Secondly, reaching this target would mean surpassing the previous point of a price reversal, a strong indicator of long-term market sentiment turning in favor of the bulls.
The moving averages provide additional insight into the price action of XRP. The 50-day Exponential Moving Average (EMA), represented by the blue line, has served as dynamic support for the asset's price, propelling it toward higher levels. The 200-day EMA, depicted by the black line, lies just below the current price, reinforcing the $0.60 level as a strong support zone. This alignment of the moving averages beneath the price is a bullish signal, often interpreted as a "golden cross" in technical analysis.
The potential move toward $0.73 also aligns with the Fibonacci retracement levels – a common tool used by traders to predict areas of interest. Given the asset's recent swings, the $0.73 level coincides with a key Fibonacci level that has historically acted as a pivot point for XRP's price.

 Alex Dovbnya
 Tomiwabold Olajide
 Caroline Amosun