Disclaimer: The opinions expressed by our writers are their own and do not represent the views of U.Today. The financial and market information provided on U.Today is intended for informational purposes only. U.Today is not liable for any financial losses incurred while trading cryptocurrencies. Conduct your own research by contacting financial experts before making any investment decisions. We believe that all content is accurate as of the date of publication, but certain offers mentioned may no longer be available.
The XRP price chart just produced its first "golden cross" in 15 months, which is regarded as a bull market indicator by analysts.
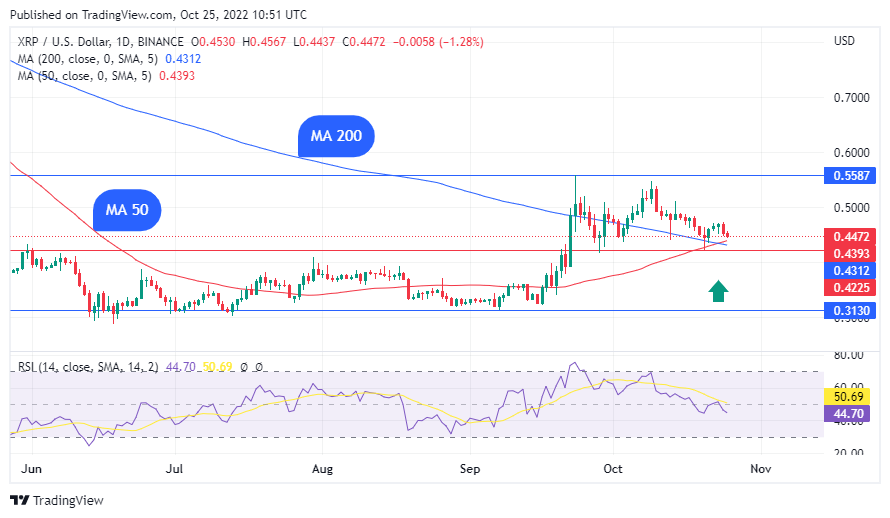
XRP's daily moving average (MA) 50 crossed above the moving average (MA) 200 on Oct. 23, validating a price chart pattern called a "golden crossover," which is a long-term bullish indicator.
The golden cross has appeared a few times on XRP charts in the past. Its last occurrence was on July 17, 2021, which was followed up by a 176% price rally later, with XRP topping out at $1.41 before reversing course to the downside.
The golden cross is frequently seen by traders and analysts as a signal of a defined uptrend. As a result, the most recent cross may draw more buying interest from trend-following traders, fueling additional price increases.
Here are key price targets
XRP's daily chart shows a barrier at $0.558, which capped gains in September. The $0.91 to $1 area, which has limited advances since December 2021, may be another obstacle for the bulls.
The golden cross is not the market's Holy Grail, it should be stressed, and it sometimes catches buyers on the wrong side of the market. This is because moving averages track prices.
Sometimes a crossover occurs when the asset is already overbought and due for a correction. XRP was a top gainer in recent months following positive developments in the Ripple lawsuit.
With the daily and weekly chart relative strength indices both below the neutral 50 level, XRP appears to be far from overbought. While an edge might be given to sellers in the meantime, buyers may gain the upper hand if the price returns above the $0.51 mark.
At the time of publication, XRP was trading at $0.446, down 1.59% in the last 24 hours. Other major cryptocurrencies were nursing slight losses.
 Dan Burgin
 U.Today Editorial Team