Disclaimer: The opinions expressed by our writers are their own and do not represent the views of U.Today. The financial and market information provided on U.Today is intended for informational purposes only. U.Today is not liable for any financial losses incurred while trading cryptocurrencies. Conduct your own research by contacting financial experts before making any investment decisions. We believe that all content is accurate as of the date of publication, but certain offers mentioned may no longer be available.
XRP has recently entered a symmetrical triangle pattern following its reversal from a local top at around the $0.51 price range. This technical formation suggests that traders can expect a spike in volatility in the near future, as the asset is likely to break out of the pattern and resume a more decisive trend.
A symmetrical triangle is a chart pattern characterized by converging trendlines connecting a series of lower highs and higher lows, with the price oscillating between these levels.
The pattern typically forms during periods of consolidation, as market participants anticipate the next significant price movement. As the triangle narrows, the pressure builds, often resulting in a breakout in either the upward or downward direction. A breakout from the symmetrical triangle is commonly considered a trigger for increased volatility.
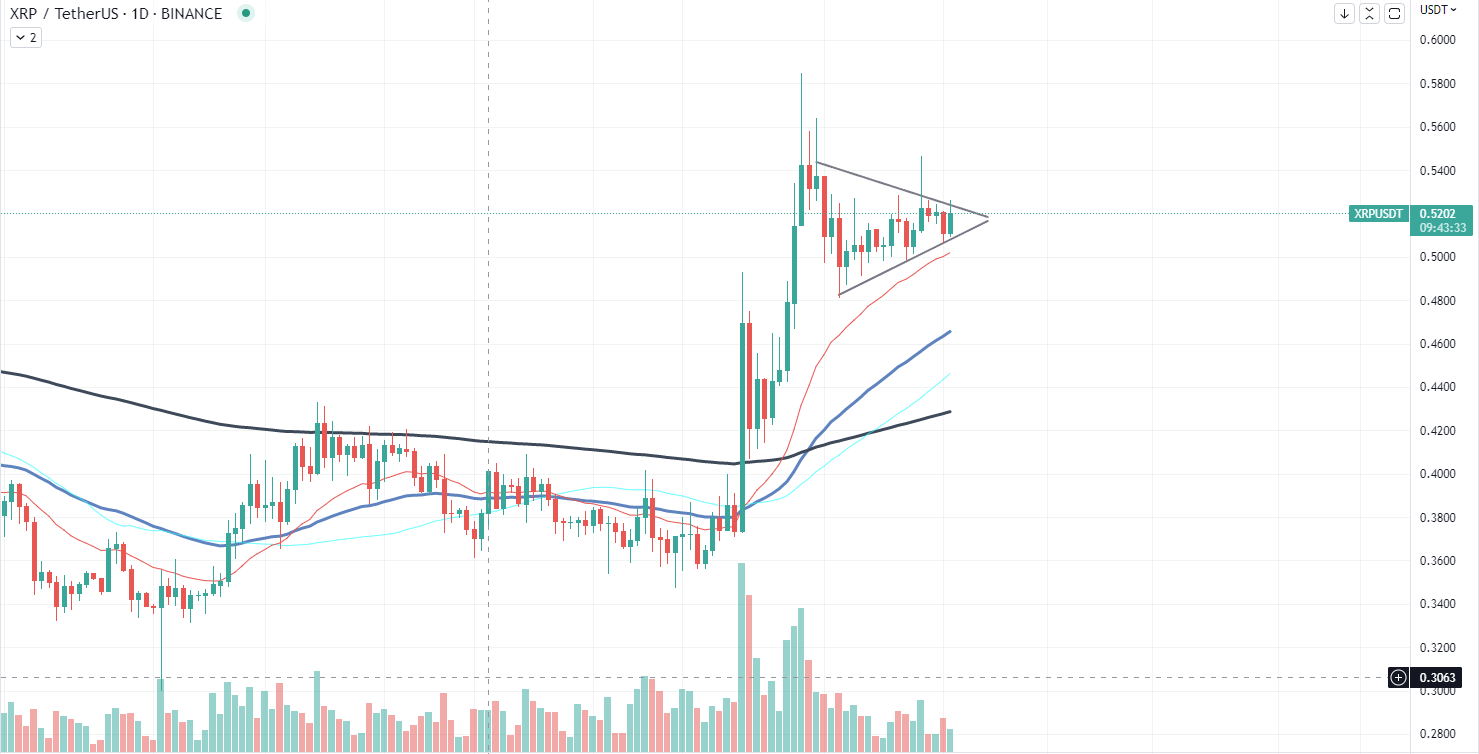
One key indicator to watch within this pattern is the divergence between moving averages. In the case of XRP, if the shorter-term moving average starts to cross above the longer-term moving average, it could be a sign of bullish momentum. Conversely, if the shorter-term moving average crosses below the longer-term moving average, it could signal that bearish pressure is mounting.
Arbitrum on rise again
Arbitrum has witnessed a strong rebound from its local low, following the introduction of AIP-1.1 and AIP-1.2 proposals. These proposals aim to enhance the governance structure and operational transparency of the Arbitrum ecosystem, which has led to renewed investor confidence and a significant price increase. At present, Arbitrum is trading at $1.7, marking 10% growth and surpassing the average price at which airdrop holders were actively selling.

AIP-1.1, the first proposal, introduces a lockup period, a budget and transparency reporting requirements for the 7.5% of $ARB tokens distributed to the Arbitrum Foundation's "Administrative Budget Wallet." This wallet is designated to cover ongoing administrative and operational costs of the Arbitrum Foundation, payment of service providers, and foster the growth and development of the Arbitrum ecosystem. In response to the 7.5% distribution, a transparency report regarding the 0.5% that has already been transferred is now available.
AIP-1.2, the second proposal, amends the Constitution, The Arbitrum Foundation Amended & Restated Memorandum & Articles of Association (A&R M&A) and Bylaws. The proposed amendments aim to remove references to AIP-1 and incorporate changes reflecting feedback from the community.
LINK's unexpected rebound
Chainlink (LINK) has surprised investors with an unexpected price spike, delivering a remarkable 16% profit to those who held the cryptocurrency. This sharp rally could be attributed to the recent unlocking of Ethereum, which triggered a surge in volatility and risk-demand across the cryptocurrency market.
In addition to market-wide factors contributing to this rapid growth, LINK is on the cusp of forming a golden cross signal, a bullish indicator that could potentially accelerate the rally even further. The golden cross occurs when a short-term moving average, such as the 50-day moving average, crosses above a long-term moving average, such as the 200-day moving average. This technical signal is generally considered a positive sign for the asset, as it suggests that the momentum is shifting in favor of bulls.
However, it is important to note that the relative strength index (RSI) for LINK is currently at 74, which is well into overbought territory. The RSI is a momentum indicator that measures the speed and change of price movements on a scale of 0 to 100. An RSI value above 70 typically indicates that an asset is overbought and could be due for a price correction, while a value below 30 suggests that the asset is oversold and may be undervalued.
 Dan Burgin
 U.Today Editorial Team