
Disclaimer: The opinions expressed by our writers are their own and do not represent the views of U.Today. The financial and market information provided on U.Today is intended for informational purposes only. U.Today is not liable for any financial losses incurred while trading cryptocurrencies. Conduct your own research by contacting financial experts before making any investment decisions. We believe that all content is accurate as of the date of publication, but certain offers mentioned may no longer be available.
The Bitcoin (BTC) price has rolled back under $115,000 after trying to break higher earlier this month, and it is bad news for bulls — the price chart is lining up a combination that does not look friendly at all.
The weekly candles show the cryptocurrency topping near $117,500 and sliding into the mid-$114,000s, right as the upper Bollinger Band is capping the move and the RSI keeps tagging bearish signals. When those two major indicators raise alarm in accordance, it usually means the market bias is bearish.

On the daily chart, the price has broken below the mid-Bollinger level and is pushing toward the lower band near $111,600, a zone that has not been tested since July’s climb began.
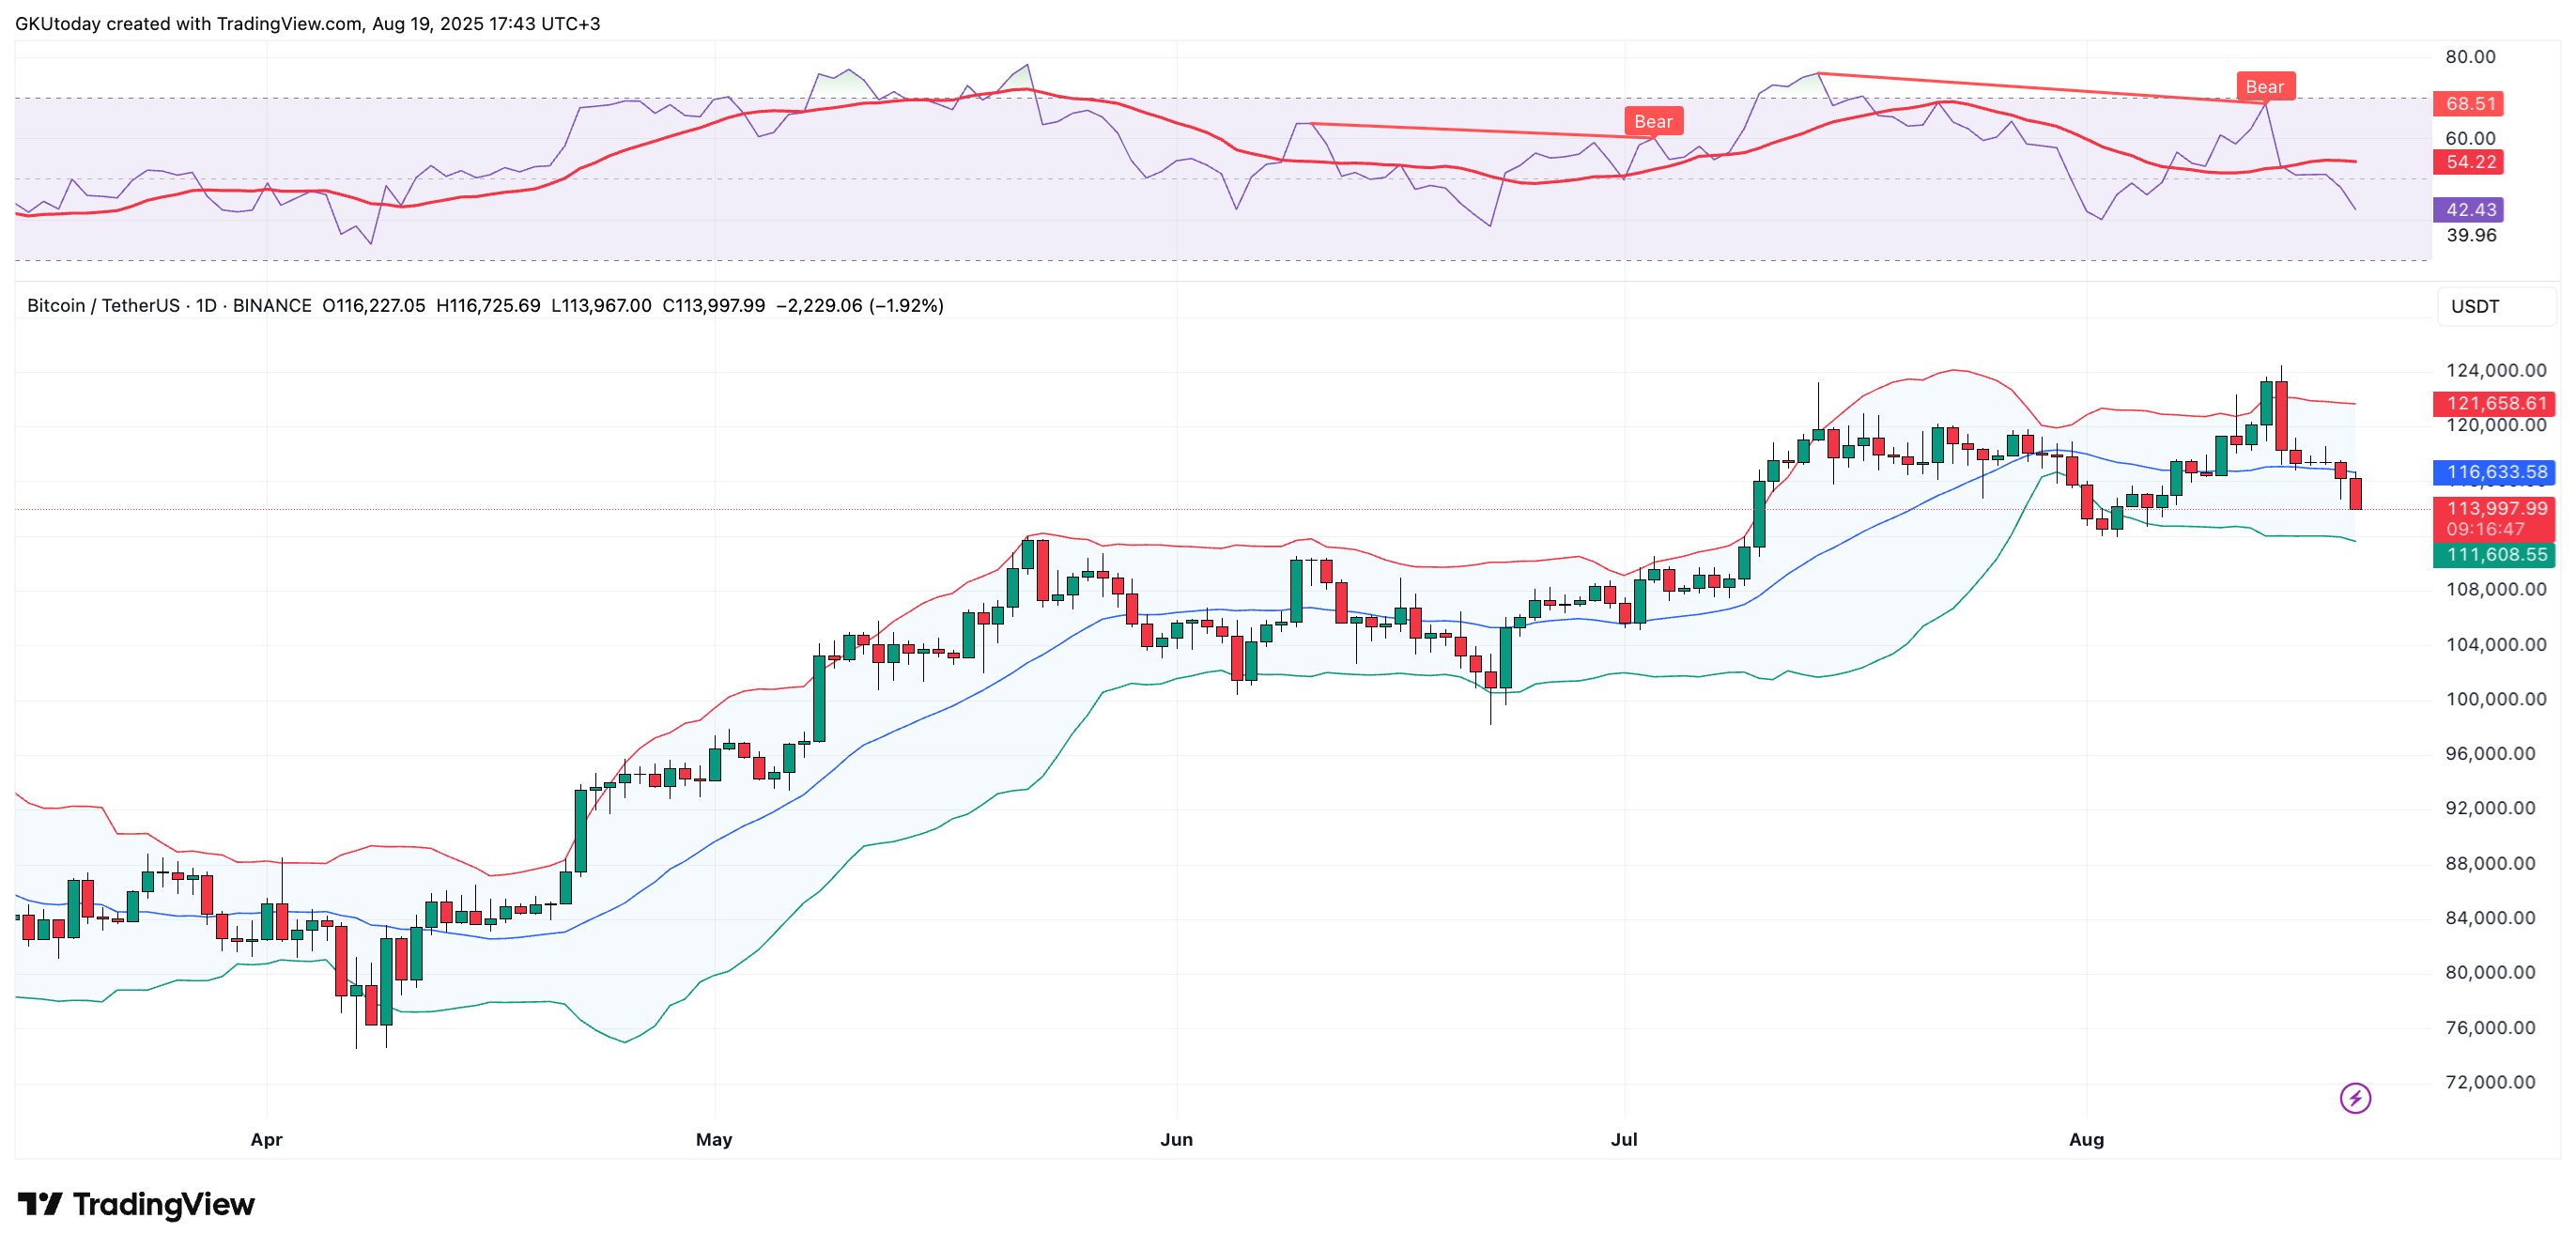
The failed spike toward $124,000 BTC left a nasty wick on the chart, the kind that often marks exhaustion, and unless Bitcoin can get back above $118,000 quickly, the next test lower looks hard to avoid.
Is it really that bad for BTC?
What makes this puzzle stand out is that both signals are saying the same thing. The RSI on daily and weekly frames has already lighted the "bear" divergence signal, and the bands themselves are widening, which is trader-speak for bigger swings coming.
The trouble is that the direction of that swing looks more south than north.

Put together, it is an "epic bearish combo" with bearish RSI divergence, middle Bollinger band loss and "down only" simple price action. Bitcoin has shaken off plenty of red flags this year, but this mix suggests the market may have to find firmer ground closer to $110,000 before any new rally can stick.
 Dan Burgin
 U.Today Editorial Team