Disclaimer: The opinions expressed by our writers are their own and do not represent the views of U.Today. The financial and market information provided on U.Today is intended for informational purposes only. U.Today is not liable for any financial losses incurred while trading cryptocurrencies. Conduct your own research by contacting financial experts before making any investment decisions. We believe that all content is accurate as of the date of publication, but certain offers mentioned may no longer be available.
Solana lost around 10% of its value in an unexpected manner. The asset that looked well-positioned for the rally after the preliminary approval of the Ethereum ETF is currently looking weaker than the rest of the market, and it's not clear if it's going to recover properly.
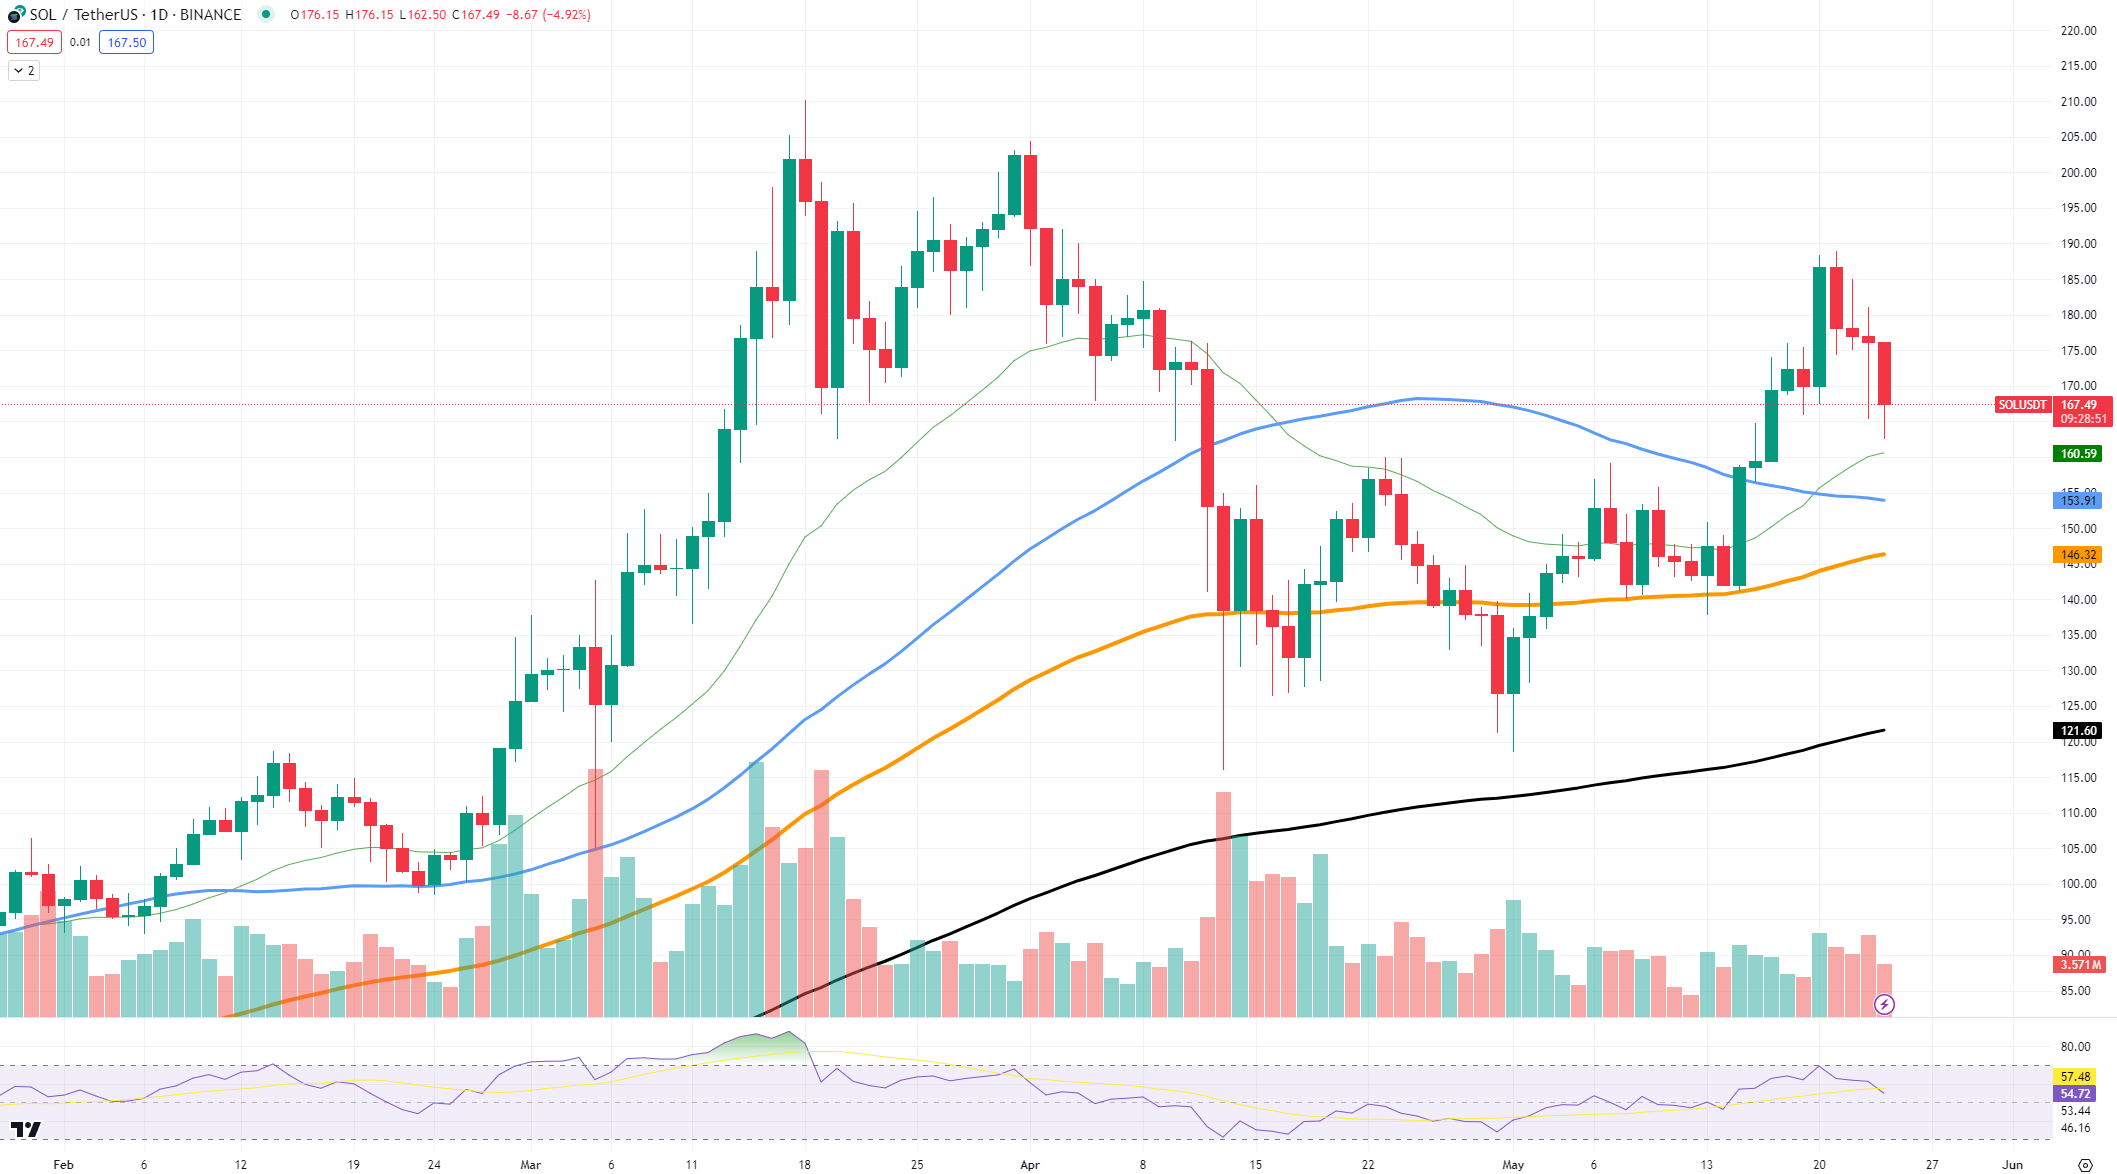
Examining the chart, Solana experienced a sharp decline, dropping from around $176 to $164. This significant drop has brought SOL down to test its support level at $160, which has previously acted as a strong support area. If this level fails to hold, the next major support lies at $150, corresponding with the 200-day moving average (orange line).

On the resistance side, Solana faces immediate resistance at $176, a level it struggled to maintain before the recent drop. Above this, the next key resistance is around $190, where the 50-day moving average (blue line) currently resides. Breaking through these levels would be necessary for any substantial recovery.
Several factors could be contributing to Solana's decline. First, market sentiment following the Ethereum ETF approval has been mixed, with some assets benefiting while others like Solana suffer. Additionally, technical factors such as failing to maintain key resistance levels might have triggered stop-loss orders, accelerating the sell-off.
For traders and investors, the $160 support level is critical. If Solana can maintain this level, it may consolidate and attempt another upward move. However, if it breaks below $160, the next significant level to watch would be $150. This could indicate further downside potential, and investors might need to brace for more volatility.
Ethereum stays composed
The expected kick in price that many attributed to Ethereum's ETF effect turned out to be a fiasco. There are quite a number of factors that could be responsible for bringing out such poor price performance, although, for the time being, the more important question remains: could there be price growth ahead, rather than talks about the failed rally?
Ethereum, until this point in time, had not been able to really breach key resistance levels, even after ETF approval. Critical reasons behind this are the kind of approval — it was not the full-blown S-1 type — and, hence, the doors for further regulatory issues are still open.
Besides, the Division of Trading and Markets gave this consent under delegated authority, which is subject to challenge over the next 10 days. All this amounts to some additional uncertainty that adds to the overall position of the markets.
But it is not all bad over the long term. The plain fact that any acceptance of an Ethereum ETF, even partial, sets a precedent in this space and sets off further potential and larger instances of crypto adoption.
Cardano's weird position
Cardano is not the most noted asset in the market, does not bring much volatility and, therefore, did not form very noticeable moves in previous weeks. However, we can see some potential here because ADA is approaching a major support, which can afterwards serve as a base for a reverse.
At this point, the chart is showing Cardano establishing a new level of support around $0.45. This level has been tested several times and has held up under the pressure of the downside, perhaps pointing to some real interest in that price. The volume spike on this new movement definitely strengthens the case for this to be an important level for the price. If ADA can hold onto this level, it might serve as a nice base upon which to initiate an upward move.
On a daily chart, ADA has its immediate resistance located at $0.50. This is a price level at which the ticker has seen rejections in the onward price action for the last couple of days. One critical thing to note is that once breached, the current fanatical rally could see a target at $0.55, exactly where the 200-day moving average lies.


 Caroline Amosun
 Tomiwabold Olajide
 Dan Burgin
 Gamza Khanzadaev
 Arman Shirinyan