Disclaimer: The opinions expressed by our writers are their own and do not represent the views of U.Today. The financial and market information provided on U.Today is intended for informational purposes only. U.Today is not liable for any financial losses incurred while trading cryptocurrencies. Conduct your own research by contacting financial experts before making any investment decisions. We believe that all content is accurate as of the date of publication, but certain offers mentioned may no longer be available.
PEPE has received a lot of hate and praise in the past. The questionable composition of holders was a huge red flag for the meme asset that killed off the momentum it was gaining in early 2024. However, as time went by and funds were redistributed, PEPE received a chance to recover and went for it.
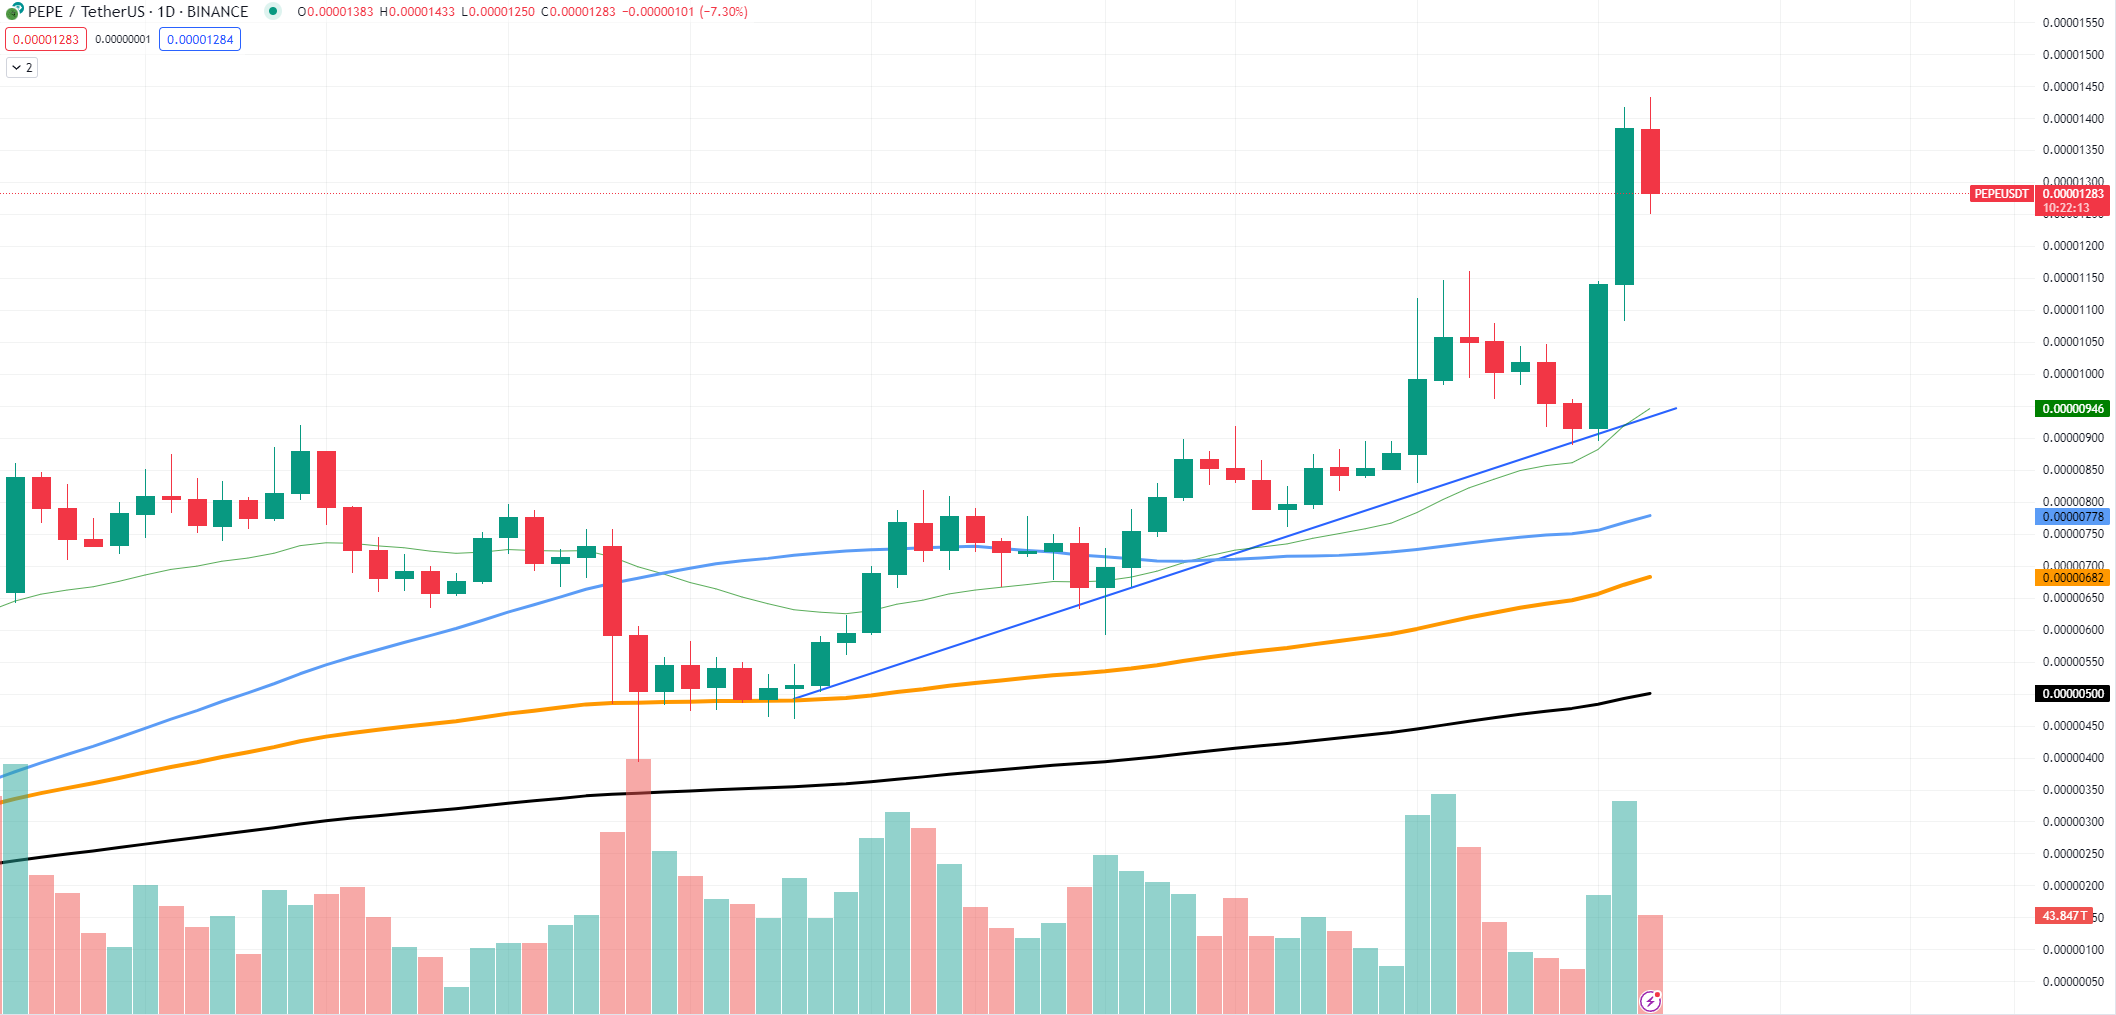
In recent days, PEPE has surged by an impressive 175%. The reason behind that rally is most likely a part of the improving sentiment among traders and investors. The momentum on PEPE is enormous, almost every single resistance has been broken, and it is unclear what could stop it, unless profit-taking is in place.

The moving averages on the chart provide further insights. The 50-day moving average (blue line) has crossed above the 200-day moving average (orange line), forming a "golden cross." This is typically seen as a bullish indicator, suggesting that the current uptrend could continue. Additionally, the volume of trades has been high, reinforcing the bullish sentiment.
Moving averages are currently offering an additional insight. With the golden cross intact, bullish PEPE holders might start increasing their positions, which is expected to push its value even further. The volume is also there, which creates a good foundation for the price.
The Relative Strength Index (RSI) is currently at 72, indicating that PEPE is in overbought territory. Of course, it may cause a potential pullback but is unlikely to affect the situation in the long term, as RSI tends to dive and surge quite often.
Bitcoin's chances at $70,000
Despite the excitement, Bitcoin could not sustain its value above $70,000. It has now dipped below this anticipated threshold. Currently, BTC is trading around $69,700. There is always a chance for a rebound. Here's why.
Bitcoin recently reached the $70,000 mark. It was unable to hold onto it, slipping below that level. However, there are reasons to believe it could make a comeback.
On-chain metrics: Data indicates that 97% of BTC holders are seeing profits at this price point. This suggests that many long term investors are doing well financially, creating a foundation that may prevent significant sell-offs.
Whale concentration: Eleven percent of BTC ownership belongs to large holders, known as "whales." This lower concentration helps mitigate the risk of large scale sell-offs that could impact prices negatively.
Transaction volumes: Noteworthy transactions exceeding $100K totaled $93.77 billion during the week. This heightened activity among investors is a sign. Furthermore, with exchange inflows and outflows balancing at around $9.7 billion, it indicates that investors are not rushing to cash out their holdings.
Market overview: The general outlook appears optimistic, supported by encouraging developments such as the possibility of ETF approval and growing attention from investors. Bitcoin typically follows these patterns, potentially propelling it to exceed the $70,000 mark again.
Solana secured $180
Solana remains one of the strongest assets on the market at this point in time. The "Ethereum killer" has retraced massively in the past, leaving investors in shambles, even with SOL at $140. However, after it reached $180, the profitability surged, but will it stay that way?
Solana might be facing a correction phase. Technical indicators, such as the RSI, are nearing overbought levels, suggesting that the asset might be due for a pullback. Additionally, the price has hit a key resistance level that could trigger profit-taking among short-term traders.
A correction phase is obviously a possibility; technical indicators like RSI are close to overbought levels and key resistances are broken, which could cause profit-taking, and sentiment indicators suggest an upcoming correction.
Historical data indicates that Solana has experienced sharp corrections following substantial rallies. The current market environment, with its inherent volatility, adds to the uncertainty. While the fundamentals of Solana remain strong, and its ecosystem continues to grow, these factors do not entirely shield it from short-term market corrections.
If Bitcoin and other major cryptocurrencies show signs of weakness, Solana could also see downward pressure. The interconnectedness of the crypto market often means that a decline in leading assets can lead to corrections in altcoins.


 Tomiwabold Olajide
 Caroline Amosun