
Disclaimer: The opinions expressed by our writers are their own and do not represent the views of U.Today. The financial and market information provided on U.Today is intended for informational purposes only. U.Today is not liable for any financial losses incurred while trading cryptocurrencies. Conduct your own research by contacting financial experts before making any investment decisions. We believe that all content is accurate as of the date of publication, but certain offers mentioned may no longer be available.
Solana has broken through a critical resistance level, marking a potential trend shift for the cryptocurrency. The chart indicates a significant break of the upper trendline resistance, establishing a new movement scenario for the asset.
Solana has showcased remarkable price performance, as evidenced by its latest rally past the upper trendline of its ascending channel. This breakthrough is a classical technical confirmation of bullish sentiment, and it suggests the possibility of a sustained upward trajectory. With SOL's price pushing through the $130 mark, the cryptocurrency has not only defied immediate resistance but has set the stage for testing further highs.
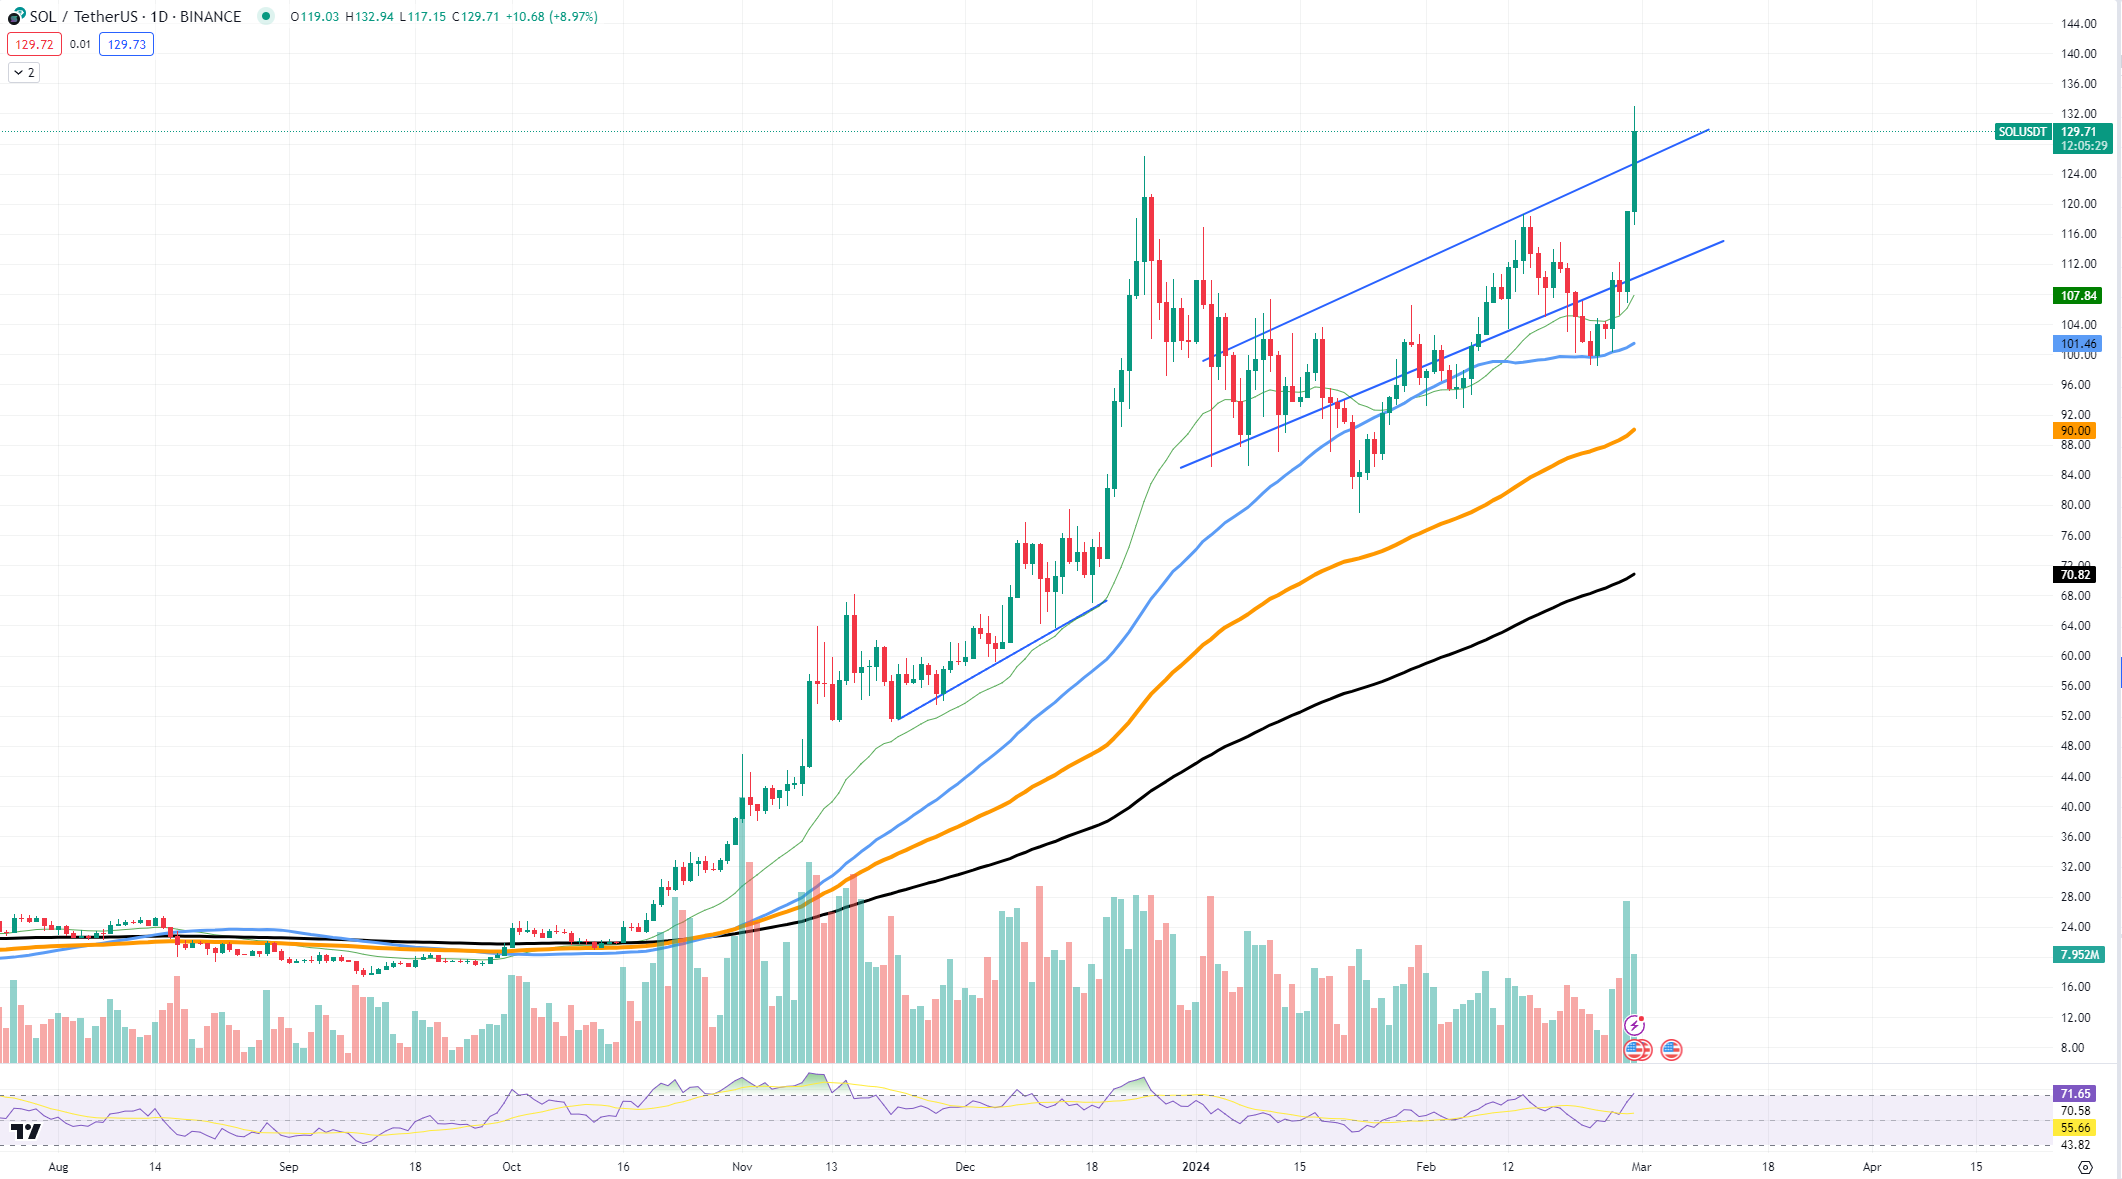
Looking at the support levels, Solana's price is comfortably positioned above the 50-day (orange line) and 100-day (blue line) moving averages, which have historically acted as dynamic support in uptrends.
The immediate support level now stands around the $107 mark, which coincides with the previous resistance-turned-support trendline. The robust volume accompanying the breakout adds credence to the bullish outlook, indicating strong buyer interest.
Conversely, the next resistance level to watch is near the $140 zone, where profit-taking and psychological round numbers may temporarily stall the rally.
Ethereum looks unstoppable
Ethereum continues its meteoric rise, currently showcasing a price surge that has left investors and enthusiasts in a state of euphoria. However, amid the celebration, if a vigilant eye is cast toward the chart, signs of a potential bearish reversal loom, warranting a closer analysis of the second-largest cryptocurrency's extraordinary rally.
Ethereum's rally has been nothing short of spectacular, with prices breaking past resistance levels with apparent ease. As of the latest trading sessions, ETH stands tall above $3,500, yet this unstoppable rally may have investors questioning the sustainability of such growth.

Should a reversal occur, the focus would shift to potential support levels that could cushion Ethereum's descent. The $2,695 mark emerges as a critical juncture, aligning with the 50-day moving average, a dynamic level that historically serves as a battleground between bulls and bears. A breach below this level could see Ethereum testing the $2,065 support, near the 100-day moving average, which may provide a stronger foundation for the digital asset.
The current trend indicates that while the market is riding a wave of optimism, caution is advised. Ethereum has defied traditional market expectations, but no asset is immune to corrections. The foreseeable future suggests that if traders begin to lock in profits, a bearish scenario could unfold, triggering a sell-off toward the identified support zones.
Bitcoin's strength is rising
The cryptocurrency flagship, Bitcoin (BTC), is showcasing a formidable display of strength on the market, with its price trajectory pointing sharply upward. As the market rides a wave of euphoria, the question on many investors' minds is whether Bitcoin is poised to reach new all-time highs in the near future.
Bitcoin's price has been on a relentless climb, and the latest candles on the chart reflect significant buyer confidence. Currently, the price has surged past the $60,000 resistance level, an important psychological barrier that could now be serving as a platform for further gains. The steep ascent is accompanied by a substantial increase in trading volume, indicating a strong conviction behind the move.

The moving averages - 50-day, 100-day and 200-day - are aligned in ascending order, which is a classic bullish signal. These lines are likely to act as dynamic support levels in the event of a price retracement. The 50-day moving average, in particular, has been a reliable support throughout the recent rally, suggesting that any dips might be viewed as buying opportunities by bullish investors.
As of now, the RSI is trending toward overbought territory, suggesting that Bitcoin is extending into an area where a reversal could occur. However, during strong trends, assets can remain overbought for extended periods, defying the traditional expectations of an immediate pullback.
 Dan Burgin
 U.Today Editorial Team