
Disclaimer: The opinions expressed by our writers are their own and do not represent the views of U.Today. The financial and market information provided on U.Today is intended for informational purposes only. U.Today is not liable for any financial losses incurred while trading cryptocurrencies. Conduct your own research by contacting financial experts before making any investment decisions. We believe that all content is accurate as of the date of publication, but certain offers mentioned may no longer be available.
Solana has been one of the most stable assets on the cryptocurrency market thanks to the movement above the $150 threshold. However, things are about to change considering the fact that it is barely holding onto the 100 EMA which, if breached, will certainly lead to a strong drop toward the $130 price level that coincides with the 200 EMA and acts as a strong buffer for the price.
Right now, Solana is barely hanging onto the 100-day Exponential Moving Average (EMA), which is a significant support level. For this asset, 100 EMA has in most cases been the critical point where the price reverses back upward in case of downtrends. Unfortunately for Solana, if that support is breached, then it might suffer a deep decline.
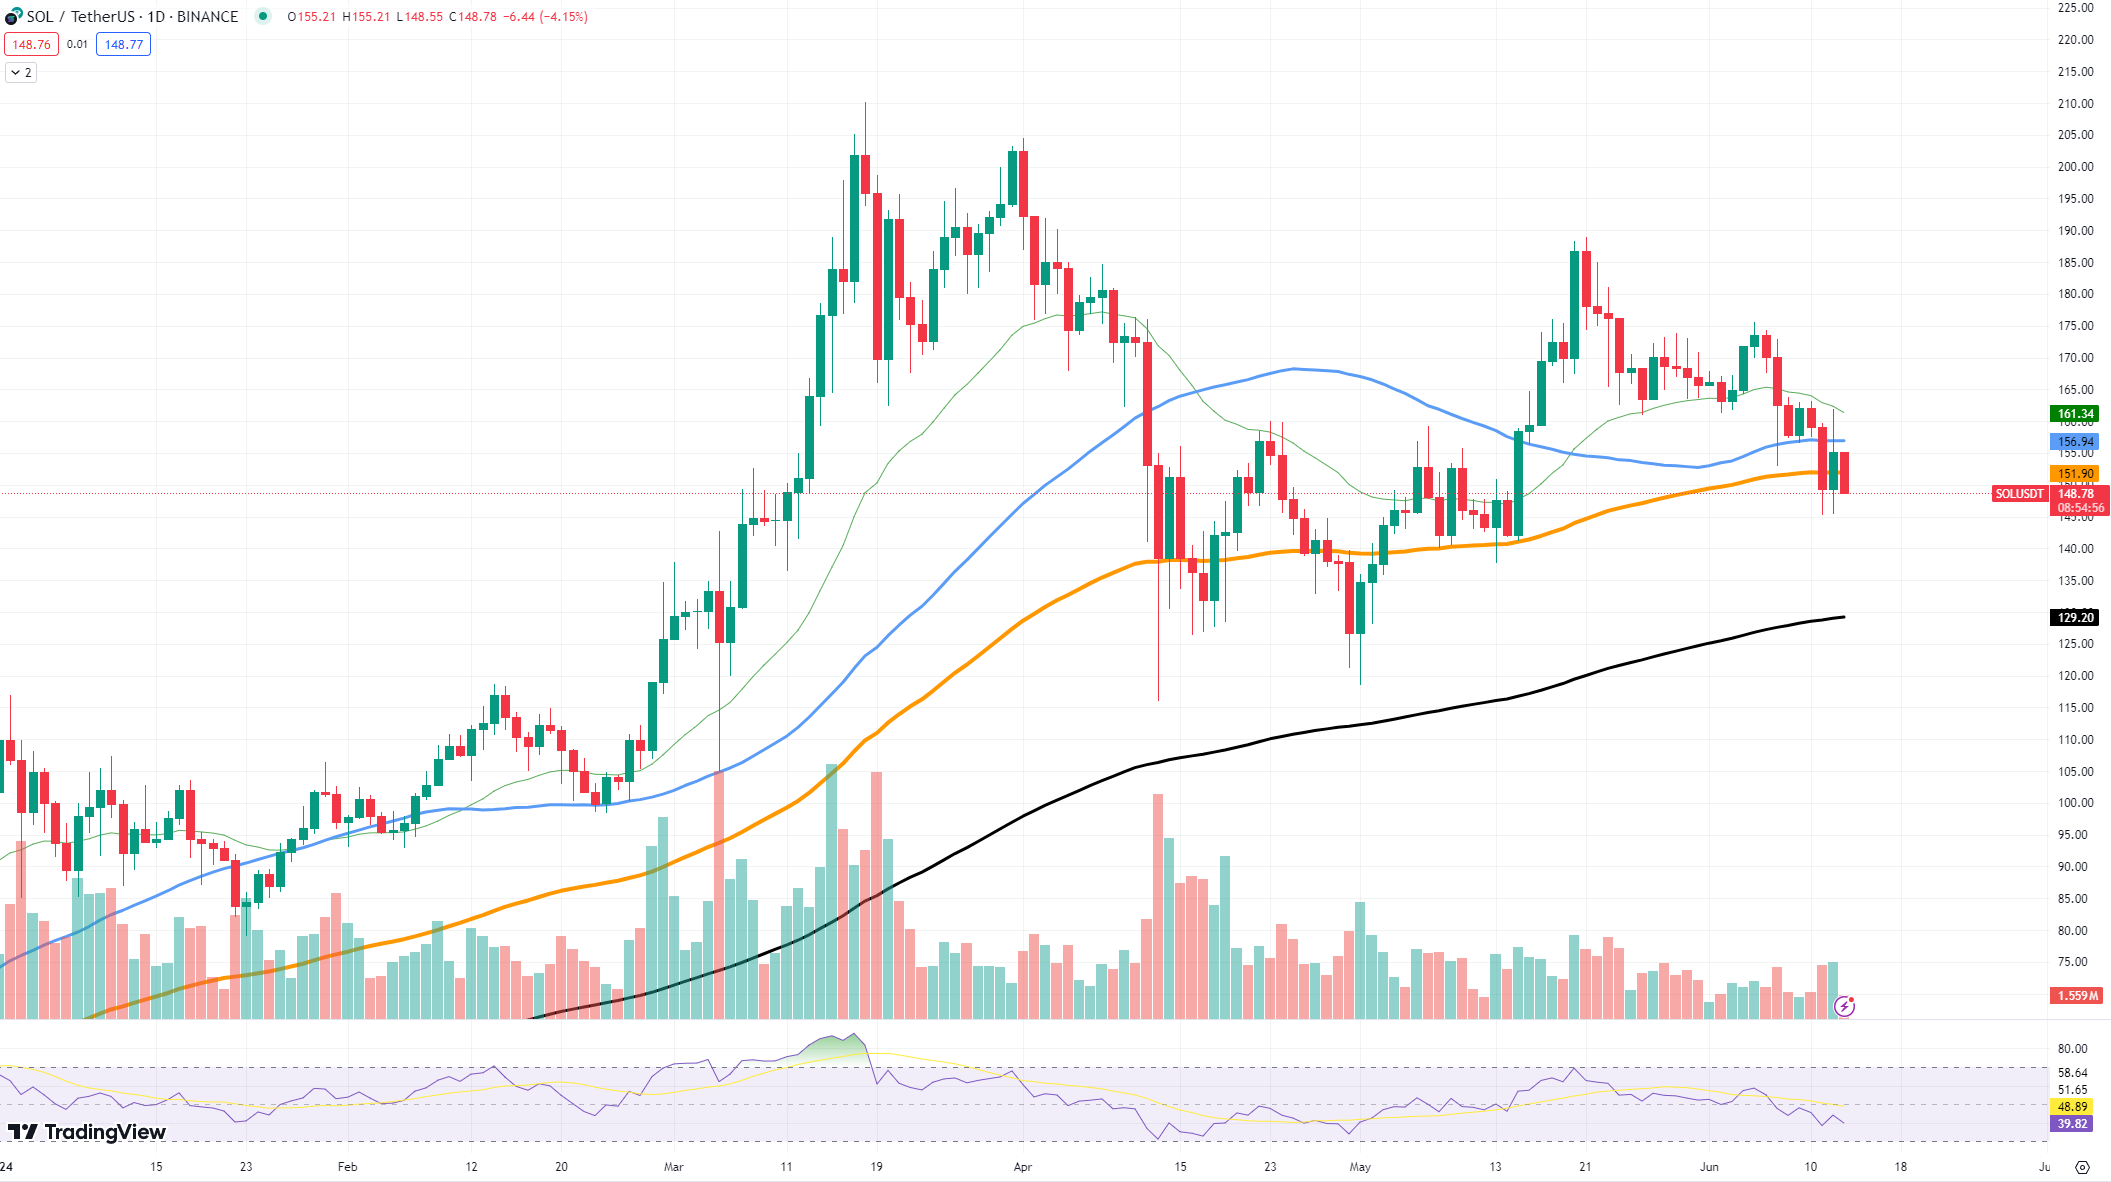
The next key support area lies around $130, which also coincides with the 200-day EMA. In technical analysis, the point where the 200 EMA crosses can be considered as a horizontal support or resistance line. However, at this level a sharp pullback may take place, inhibiting further declines in case of Solana’s price reaching that level.
When the 100 EMA breaks through, panic-selling may accelerate toward the downward trend to reach the 200 EMA at $130.
Shiba Inu's volatility
Shiba Inu has been gradually regaining value on the market, but unfortunately, the asset could not hold itself at the proper level and retraced in a dramatic fashion, losing key support levels and then plummeting toward the 200 EMA, which is the last resort support level for the asset.
For a few days until now, SHIB has struggled to hold onto its gains, facing significant downward pressure. It was helpless at the critical support levels, causing a sharp decline. As a result of this pullback, SHIB is getting closer to its 200-day Exponential Moving Average.

The 200 EMA often acts as a strong support in technical analysis, representing the average closing prices over the past 200 days. For SHIB, it is particularly important as it becomes the “last resort” support of the coin. In case this level gets broken by the asset, it will be seen as signifying a longer bearish trend that could lead to more drops.
The SHIB market has been divided into two factions with regards to its sentiment. Some people, when seeing this drop, consider it just a small lapse, while others are more cautious and think that not holding key supporting levels might indicate underlying weaknesses.
This recent price action reveals itself as a classical retracement pattern after making efforts toward recovery, indicating high volatility in the cryptocurrency industry.
It would be advisable for investors to keep track on the 200 EMA. A bounce from there may allow SHIB to reestablish new grounds toward its next bullish cycle. But breaking down below such a threshold may bring about further selling pressures and a continuation of the current downtrend.
Ethereum about to lose it
Ethereum is on the verge of losing a critical price level at $3,500. That price threshold was not followed by any support levels that would "save it" in case of a drop. So, we are seeing Ethereum struggling at $3,479, with a risk of falling lower, toward $3,300.
The price of Ethereum is currently just above $3,300, and if the bearish trend continues, it may be the next important support. This level coincides with the 200-day EMA, which is a long-term support line that traders often monitor. Failure by ETH to hold this level could indicate a more pronounced bearish trend.
Recent price action shows increased selling pressure on Ethereum. The inability of the asset to maintain $3,500 points at market volatility and troubles for ETH. The eyes of investors are now fixed on whether ETH will stabilize or continue down toward the $3,300 area of support.

Market sentiment surrounding Ethereum remains tentative at best. Some traders are hopeful that there might be a change in fortune, but immediate technical indicators suggest caution. The breach of $3,500 without any solid nearby supports is unnerving and could provoke additional selling in case prices fail to steady themselves quickly enough.
Trading volume has also been fluctuating significantly, indicating mixed feelings among investors. If volume continues rising sustainably at lower price levels, it could either signal panic-selling or an entry point for new investors, who like to join in when prices fall.
 Dan Burgin
 U.Today Editorial Team