
It seems like these days it’s all about what cryptocurrency is dropping less, which is in total opposition to the same time last year, when it wasn’t a matter of whether cryptos are going up but which one is gaining more on a daily basis.
Litecoin, just like everything else, has been in a downtrend for almost a year, but there’s a caveat; it is now testing a key level that pushed price sky high last year: $30.
Charts at a Glance – LTC/USD
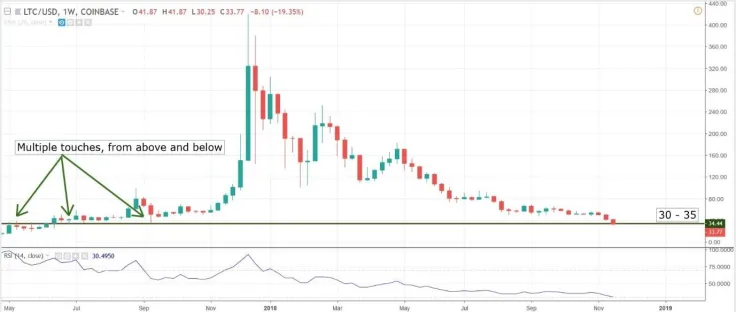
The weekly chart above shows that Litecoin hit the current level multiple times during mid-to-late 2017, just before taking off to reach its peak a few months later. As mentioned on another occasion, technical levels can suffer a so-called “degradation” if they are not touched for a long while, becoming less important (price is not as responsive to them as before). However, considering the importance of this zone, it is most likely that we will get a reaction.
The Relative Strength Index is just entering oversold territory on the weekly chart, which holds a greater importance than oversold conditions on an hourly or daily chart, and this combined with the support zone at $30 - $35 can trigger a strong bounce North. On the other hand, a break of the support zone would show that bearish pressure is still too strong and that more downside will follow.
Support zone: 30 - 35
Resistance zone: 40
Most likely scenario: bounce higher from support
Alternate scenario: break below support and move into 25 area
 Arman Shirinyan
 Alex Dovbnya
 Dan Burgin
 Denys Serhiichuk