
Disclaimer: The opinions expressed by our writers are their own and do not represent the views of U.Today. The financial and market information provided on U.Today is intended for informational purposes only. U.Today is not liable for any financial losses incurred while trading cryptocurrencies. Conduct your own research by contacting financial experts before making any investment decisions. We believe that all content is accurate as of the date of publication, but certain offers mentioned may no longer be available.
Ethereum is experiencing a prolonged period of aggressive selling pressure, leading to a marketwide sell-off. The latest data shows that ETH has significantly lost ground, with its market capitalization having dropped by billions.
At $2,314 right now, ETH's price represents a significant drop from its peak values wiping out over $32 billion in market value in a comparatively short amount of time. It appears that the constant selling activity, especially from larger holders, is the main cause of Ethereum's difficulties. The asset is now in a risky situation as a result of the chain reaction that was set off by this selling pressure.
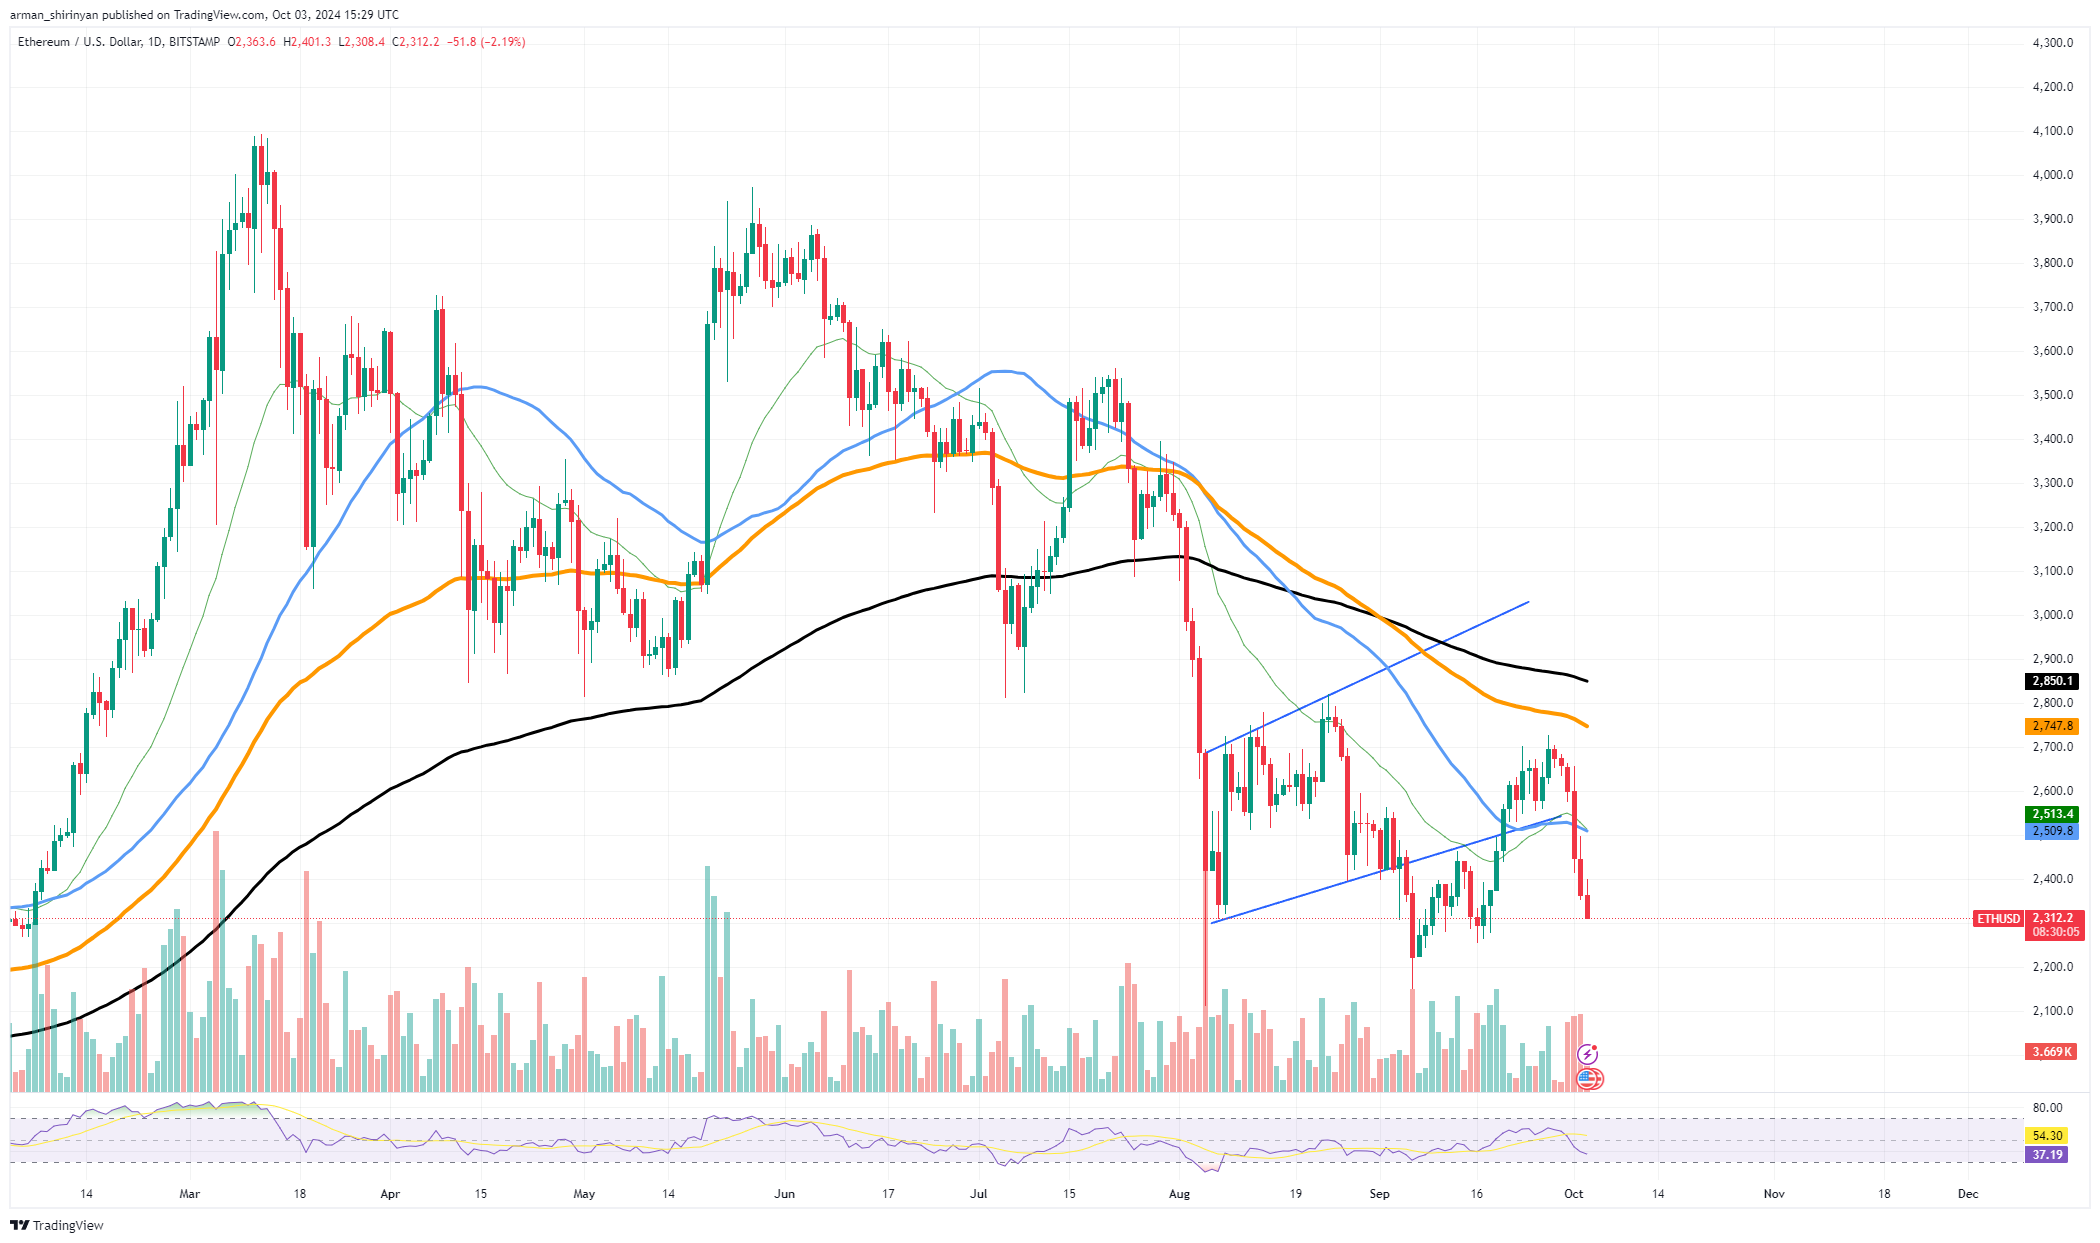
Regrettably, the downward trend seems to be intensifying, and Ethereum's short-term market outlook is not encouraging. The breakdown of key technical levels is fueling bearish sentiment among investors. The $2,300 mark is one of the most important price levels to monitor.
This barrier which, if breached, might allow for even greater losses, is where Ethereum is perilously near. The next major support is located below this at about $2,150, which is also the location of previous consolidation zones from earlier in the year. If Ethereum breaches these levels, we could see a further collapse in price, potentially moving ETH toward $2,000 or lower.
Bitcoin's strange position
After 200 days of low volatility and diminishing liquidity, Bitcoin has found itself in what many are now referring to as a limbo. Traders' frustration with Bitcoin's performance in 2024 stems from the fact that despite sporadic spikes in price, it has not been able to break out of its declining trend.
Because BTC is unable to move decisively past significant resistance levels, the chart clearly demonstrates a lack of upward momentum. It is still necessary for Bitcoin to break through the $63,000 price barrier in order to see any meaningful rebound. On the negative side, a breakdown below the $59,000 support level could trigger a more severe correction, as it is tested often. This extended period of low volatility is evident in both the price movement and decreased liquidity on exchanges.

There has been a decline in volume and a lack of decisive movement on the market as a result of numerous traders pulling out. Consequently, the capacity of Bitcoin to appreciate has been severely hindered, resulting in a difficult trading environment. At present, it seems that Bitcoin is fluctuating between pivotal levels of support and resistance.
The downward trend implies that Bitcoin may experience more losses unless there is a notable improvement in volume and market sentiment. The $63,000 resistance and the $59,000 support should be closely watched by traders, as a breakout in either direction may indicate the direction of Bitcoin's next significant move. Without a clear trigger, though, Bitcoin might keep going through this cycle of stagnation and present little hope for the foreseeable future.
XRP seeing erratic movement
Both bulls and bears are in disbelief after XRP put on one of its most erratic and chaotic performances in the last seven days. At first the symmetrical triangle pattern — a common consolidation structure — offered a directionally distinct breakout. But what happened next probably led to big losses for both parties and caught a lot of traders off guard.

When the price initially emerged from the triangle higher, many thought a bullish trend had begun. Bullish traders hoping for a prolonged rally were harmed by the false breakout scenario that resulted from this breakout's rapid retracement. However the strange price shift did not stop there.
XRP kept falling and is currently trading much below its initial breakout level rather than leveling out or consolidating once more. There were probably a lot of liquidations as a result of this erratic price movement from both bears, who were taken aback by the first false breakout and overly leveraged bulls eager for a rally.
Consequently, XRP has now fallen below important moving averages, indicating that unless notable buying pressure materializes, the asset may continue to decline. At the moment, the $0.55 support level and the $0.50 psychological barrier are two important price levels to keep an eye on for XRP.
We might witness additional downward pressure if XRP breaks below the $0.50 threshold, as this would indicate a failure to hold a significant support level. However, after this week's wild swings, XRP's ability to regain $0.55 could signal a reversal or, at the very least, some stabilization. Given its erratic price movement, XRP is still a risky asset to trade at the moment, and investors should exercise caution while it moves through this turbulent phase.
 Dan Burgin
 U.Today Editorial Team