Disclaimer: The opinions expressed by our writers are their own and do not represent the views of U.Today. The financial and market information provided on U.Today is intended for informational purposes only. U.Today is not liable for any financial losses incurred while trading cryptocurrencies. Conduct your own research by contacting financial experts before making any investment decisions. We believe that all content is accurate as of the date of publication, but certain offers mentioned may no longer be available.
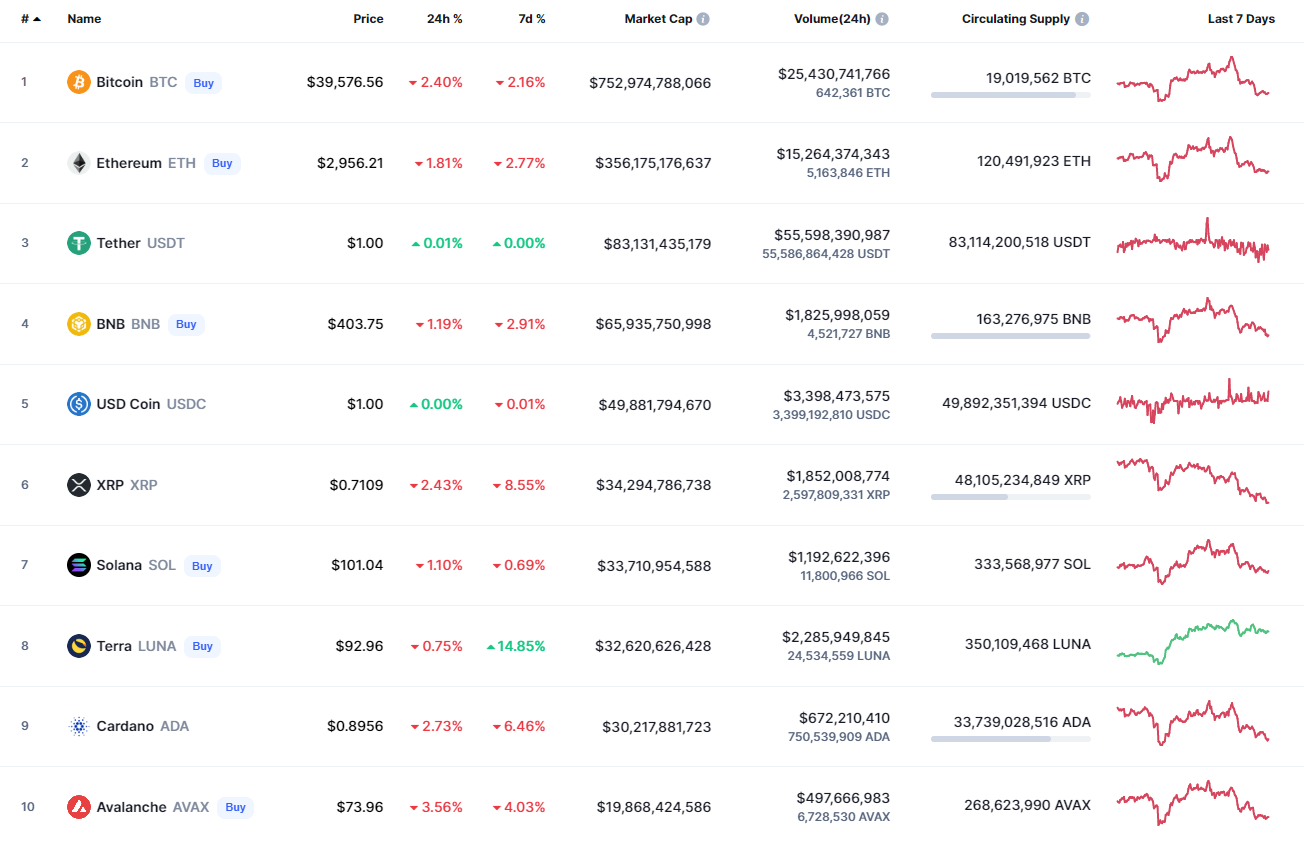
The weekends have started with the continued fall of the market. Avalanche (AVAX) is the biggest loser among the top 10 coins, going down by 3.56%.
DOGE/USD
DOGE has followed most of other coins, declining by 2% over the past 24 hours.
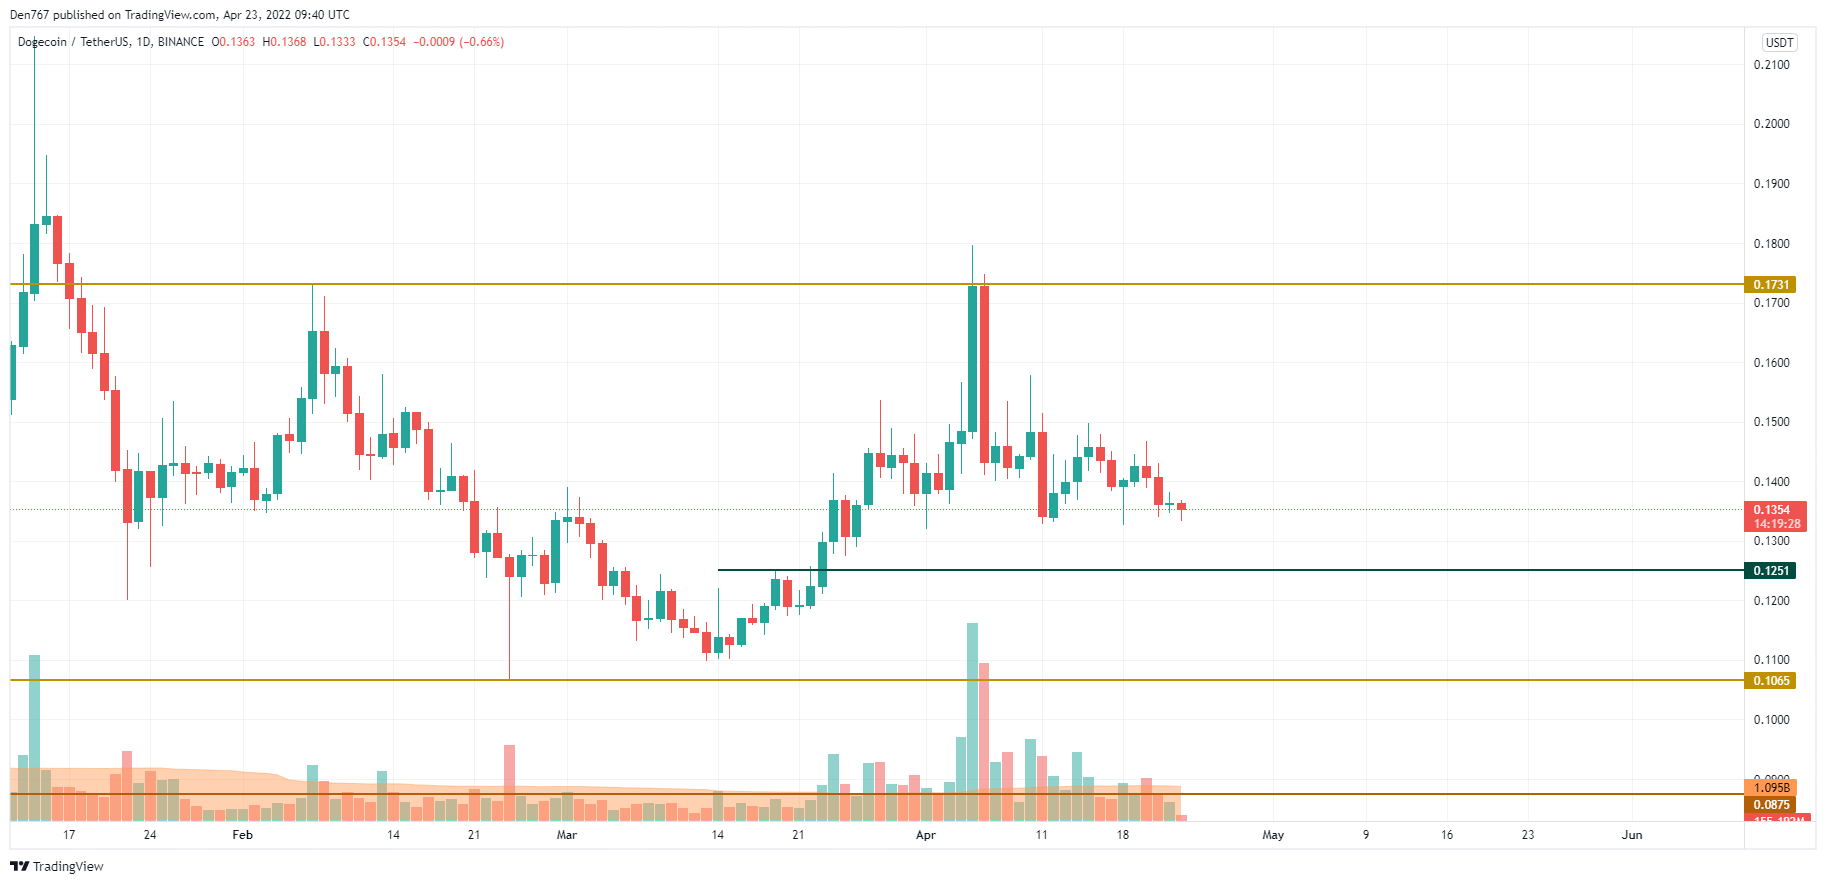
On the daily chart, DOGE is coming back to the area around $0.13 which means that the bears' pressure continues even though the volume is going down. In this case, if the breakout of $0.13 occurs, one can expect the retest of the support at $0.1251 soon.
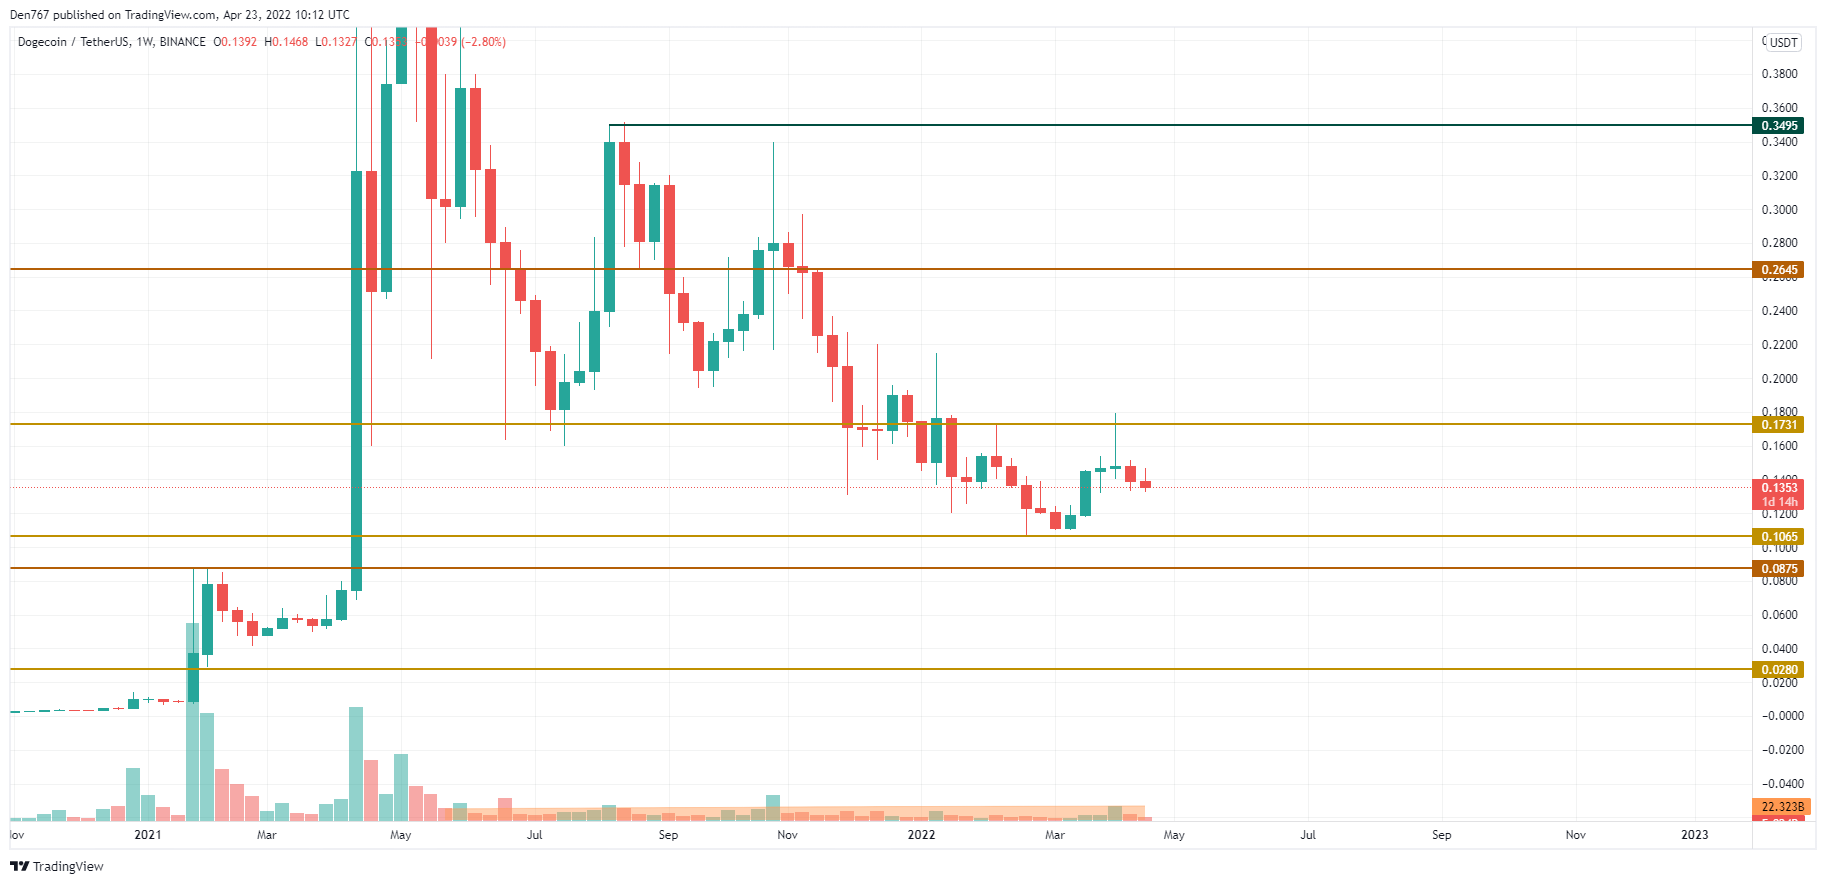
On the weekly time frame, the price is in the middle of the wide channel with neither bullish or bearish signals.
In addition, the trading volume is at its lowest levels. But if the candle fixes below $0.1320, there is a high possibility to see the further drop next week.
DOGE is trading at $0.1352 at press time.
SHIB/USD
SHIB is less loser than DOGE as the decline has accounted for 1.19%.
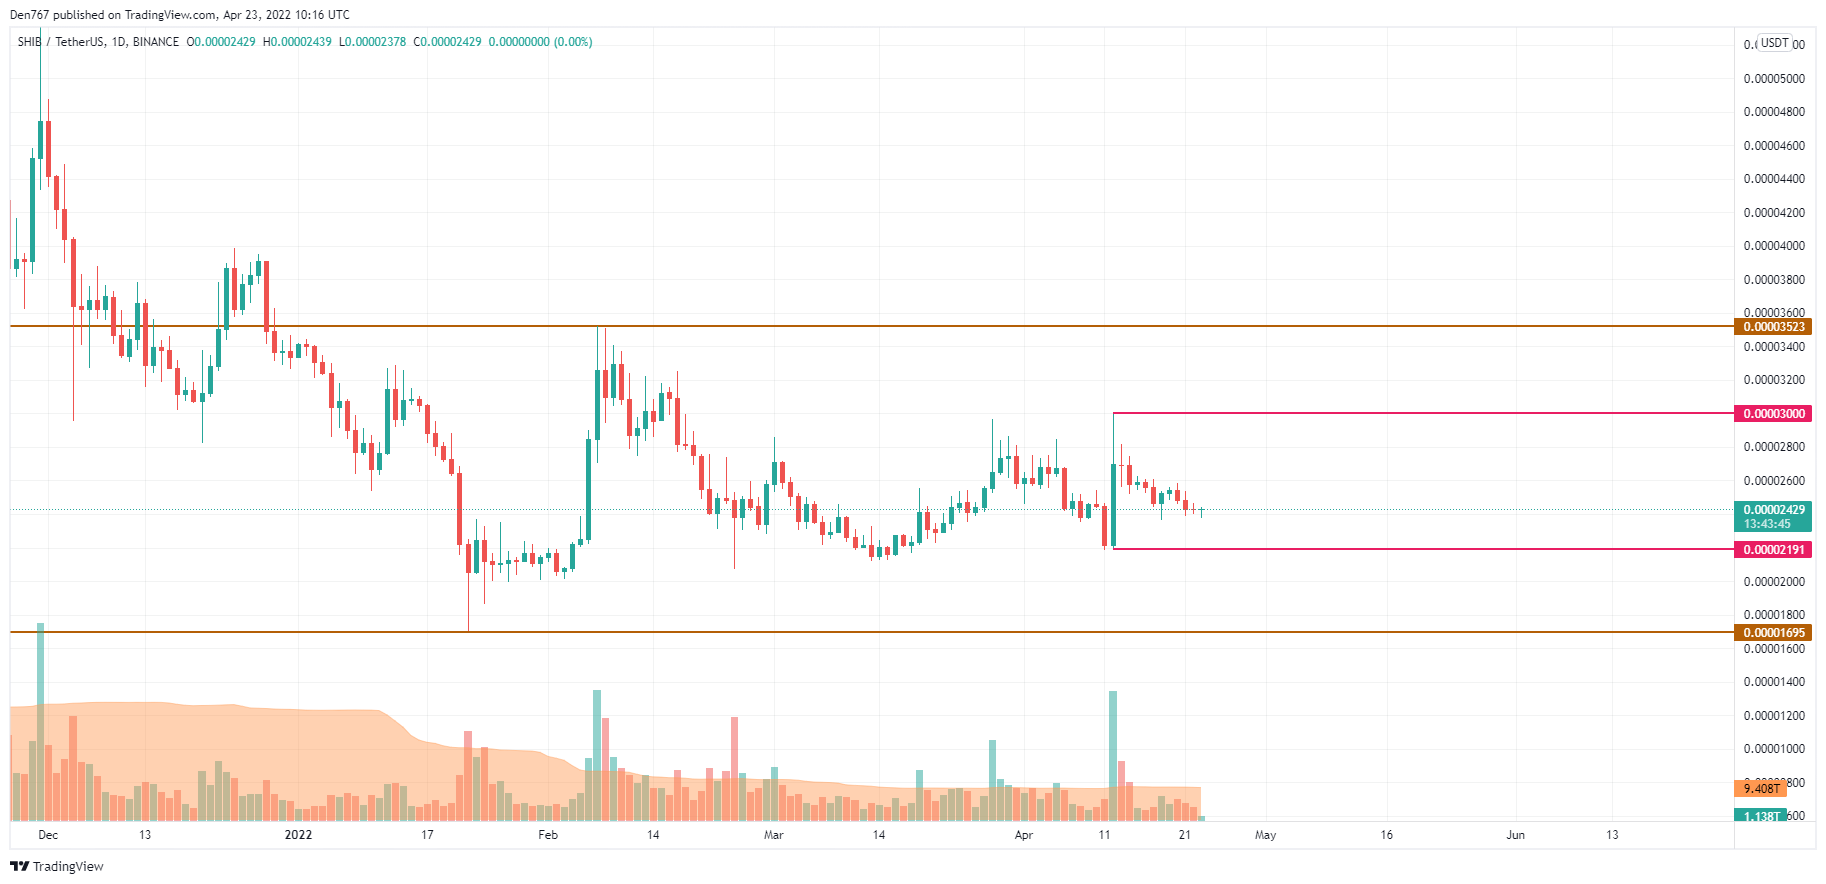
The price is located close to the local support which means that sellers are more powerful than buyers at the moment. If the rates approaches the $0.00002191 mark, there is a possbility to see the sharp drop shortly.
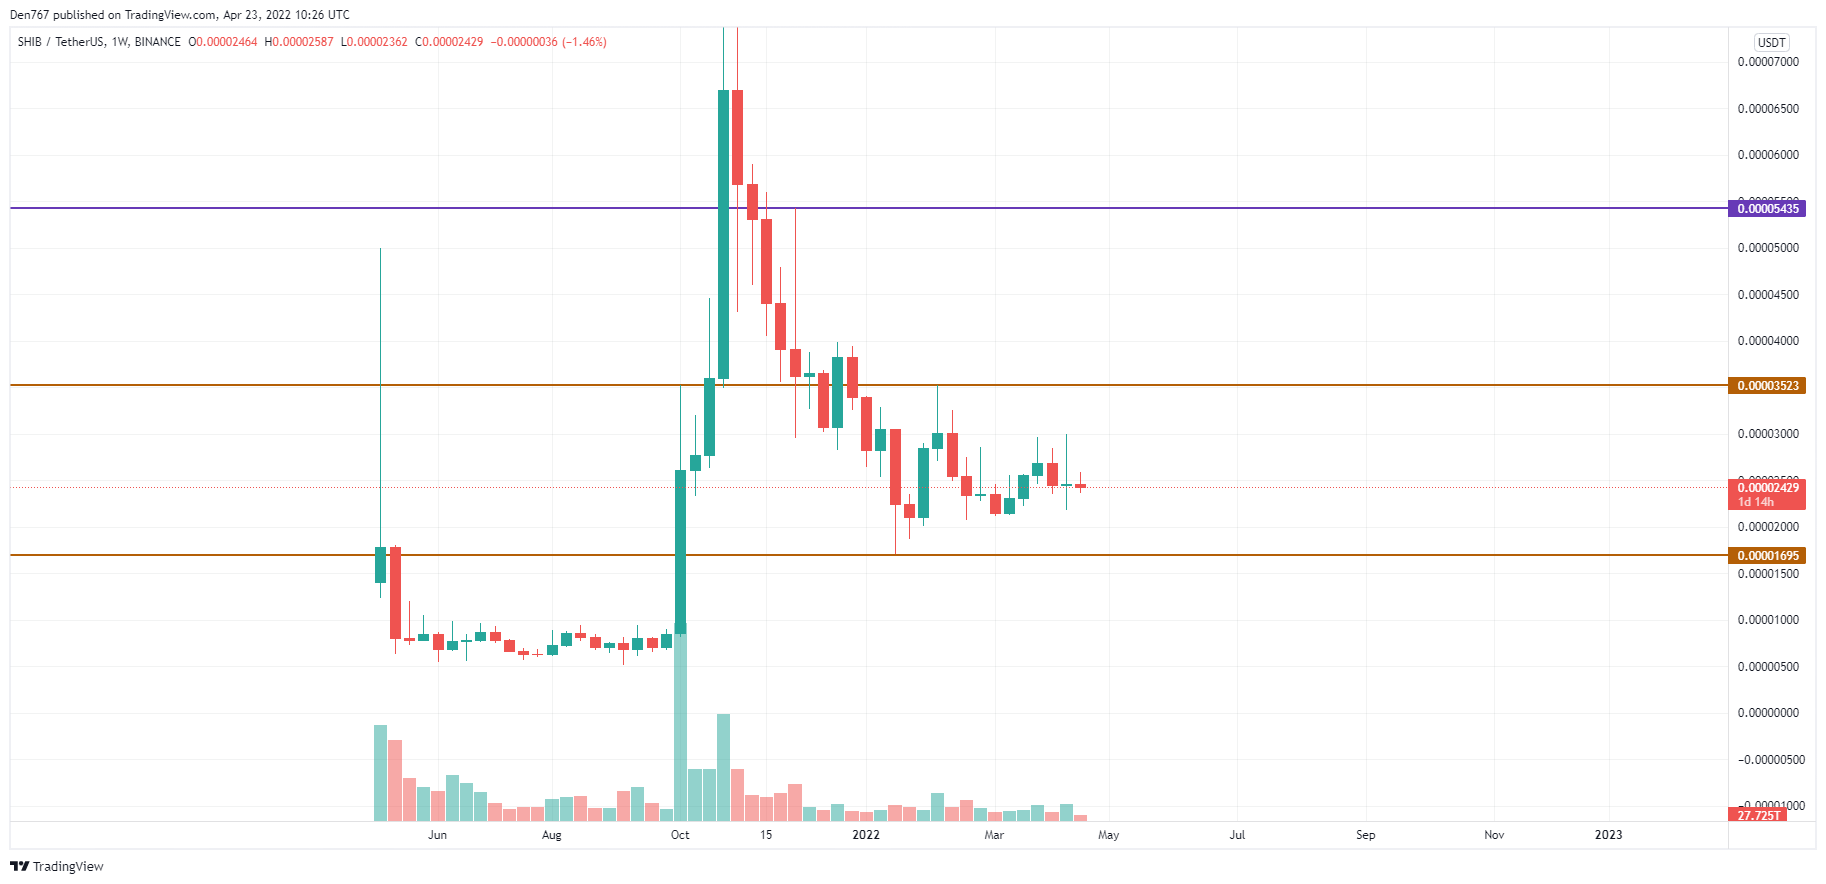
On the weekly chart, the sideways trading remains the more likely scenario as none of the sides have accumulated enough power for the further move. In this regard, SHIB is about to keep trading between $0.000020 and $0.000030 untli the end of the upcoming month.
SHIB is trading at $0.00002427 at press time.
 Dan Burgin
 U.Today Editorial Team