Disclaimer: The opinions expressed by our writers are their own and do not represent the views of U.Today. The financial and market information provided on U.Today is intended for informational purposes only. U.Today is not liable for any financial losses incurred while trading cryptocurrencies. Conduct your own research by contacting financial experts before making any investment decisions. We believe that all content is accurate as of the date of publication, but certain offers mentioned may no longer be available.
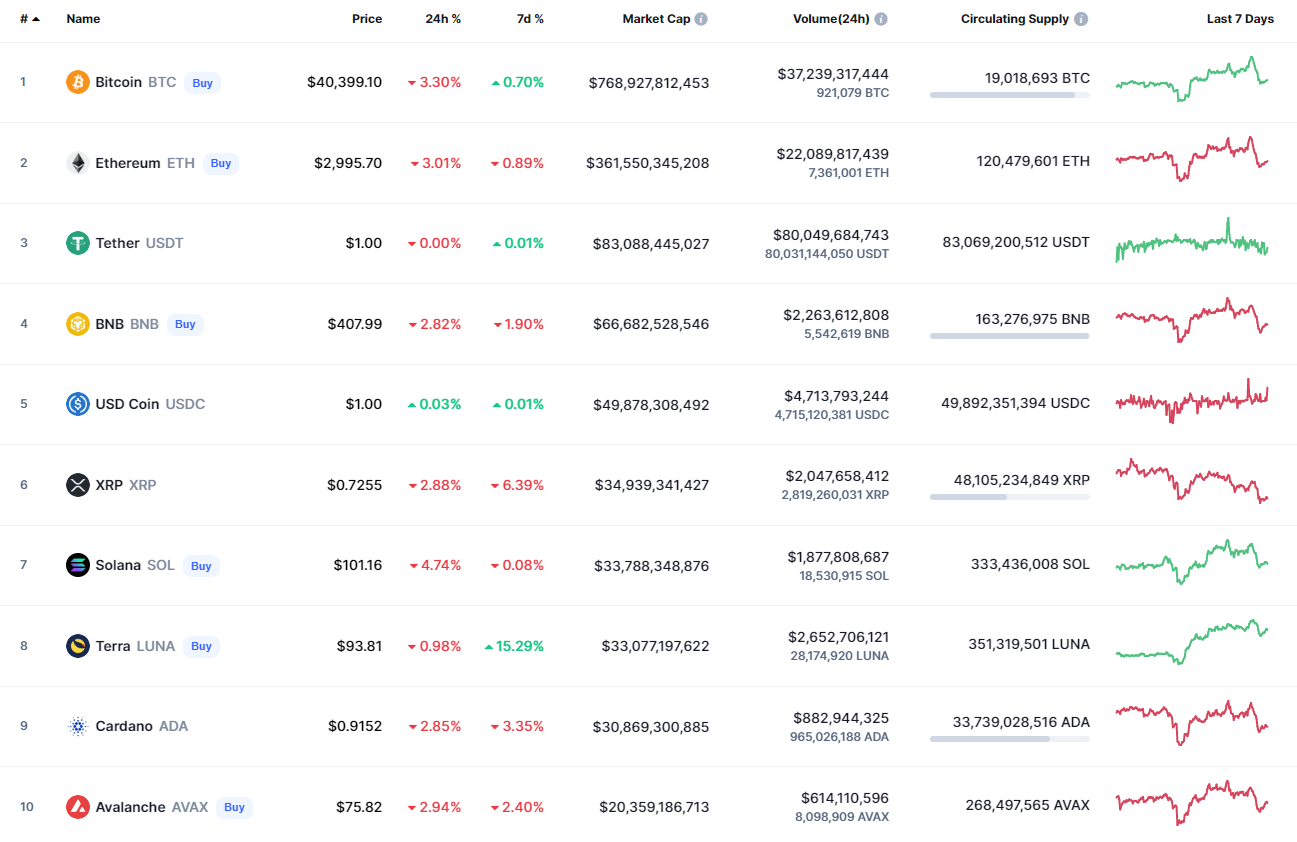
Bulls may have begun fixing their positions as all of the top 10 coins have turned to red again.
BTC/USD
Bitcoin (BTC) has failed to get to the $41,000 mark, going down by 3.39% since yesterday.
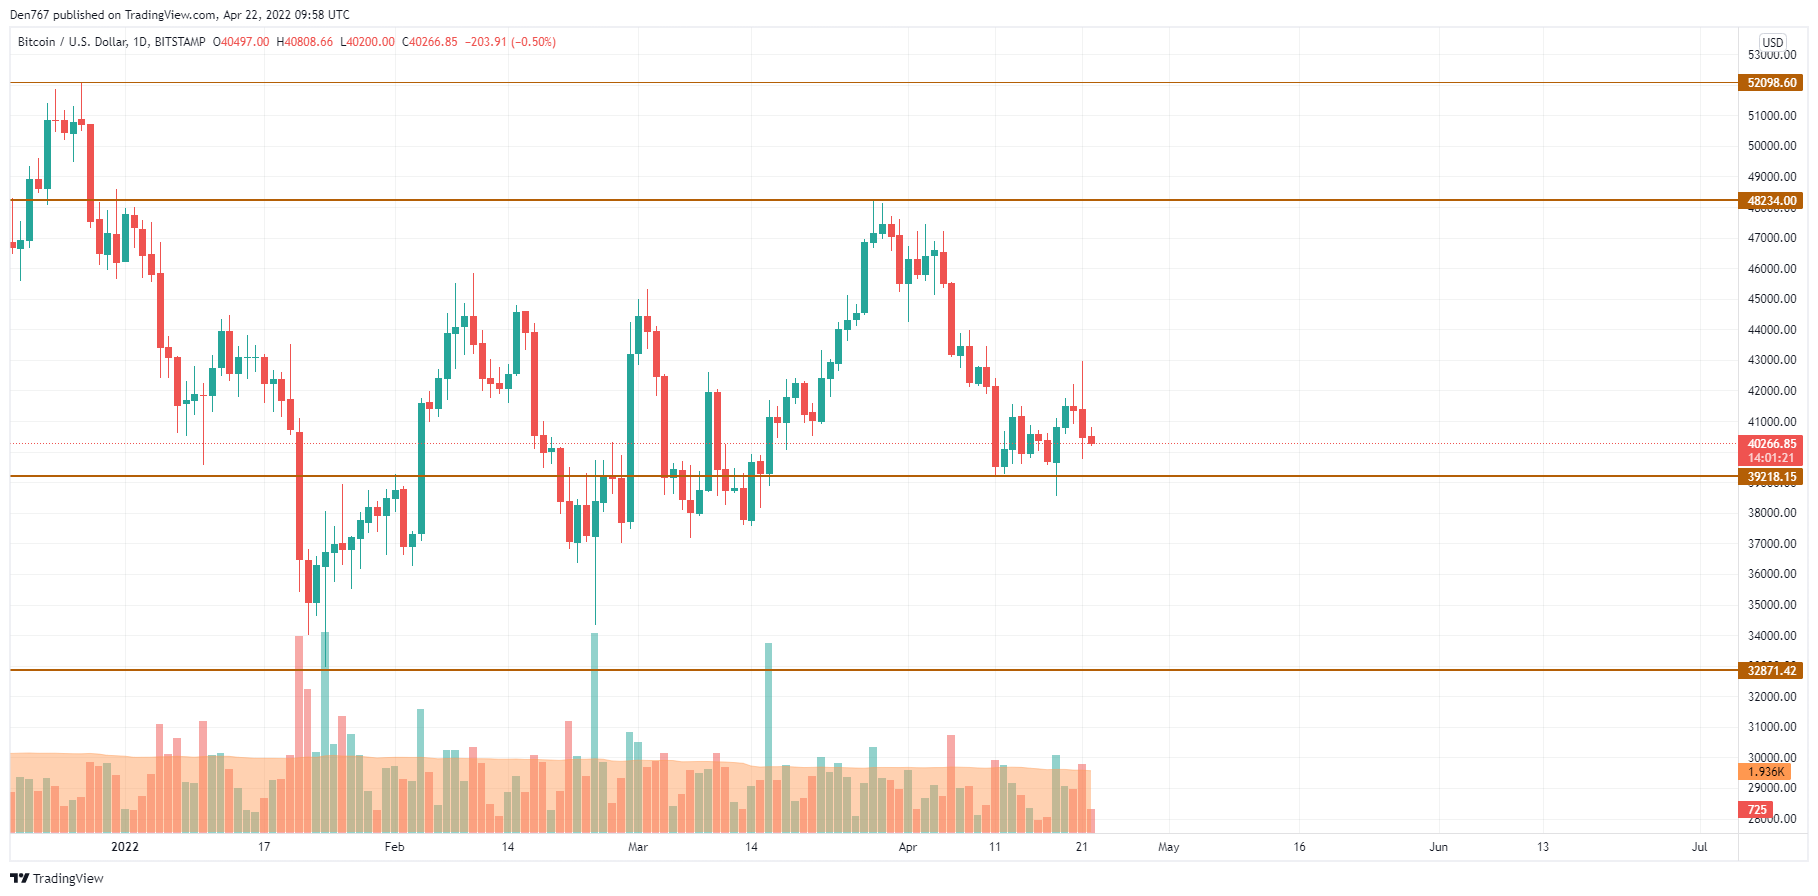
Bitcoin (BTC) is looking bearish as buyers could not return the rate to the $42,000 zone. Furthermore, the selling trading volume has increased, which confirms bulls' weakness.

If they cannot seize the initiative and the decline continues, there is a high possibility to see a breakout of the $39,218 level on the first days of May.
Bitcoin is trading at $40,376 at press time.
SOL/USD
Solana (SOL) is the biggest loser from the list, going down by 5.66% over the last day.
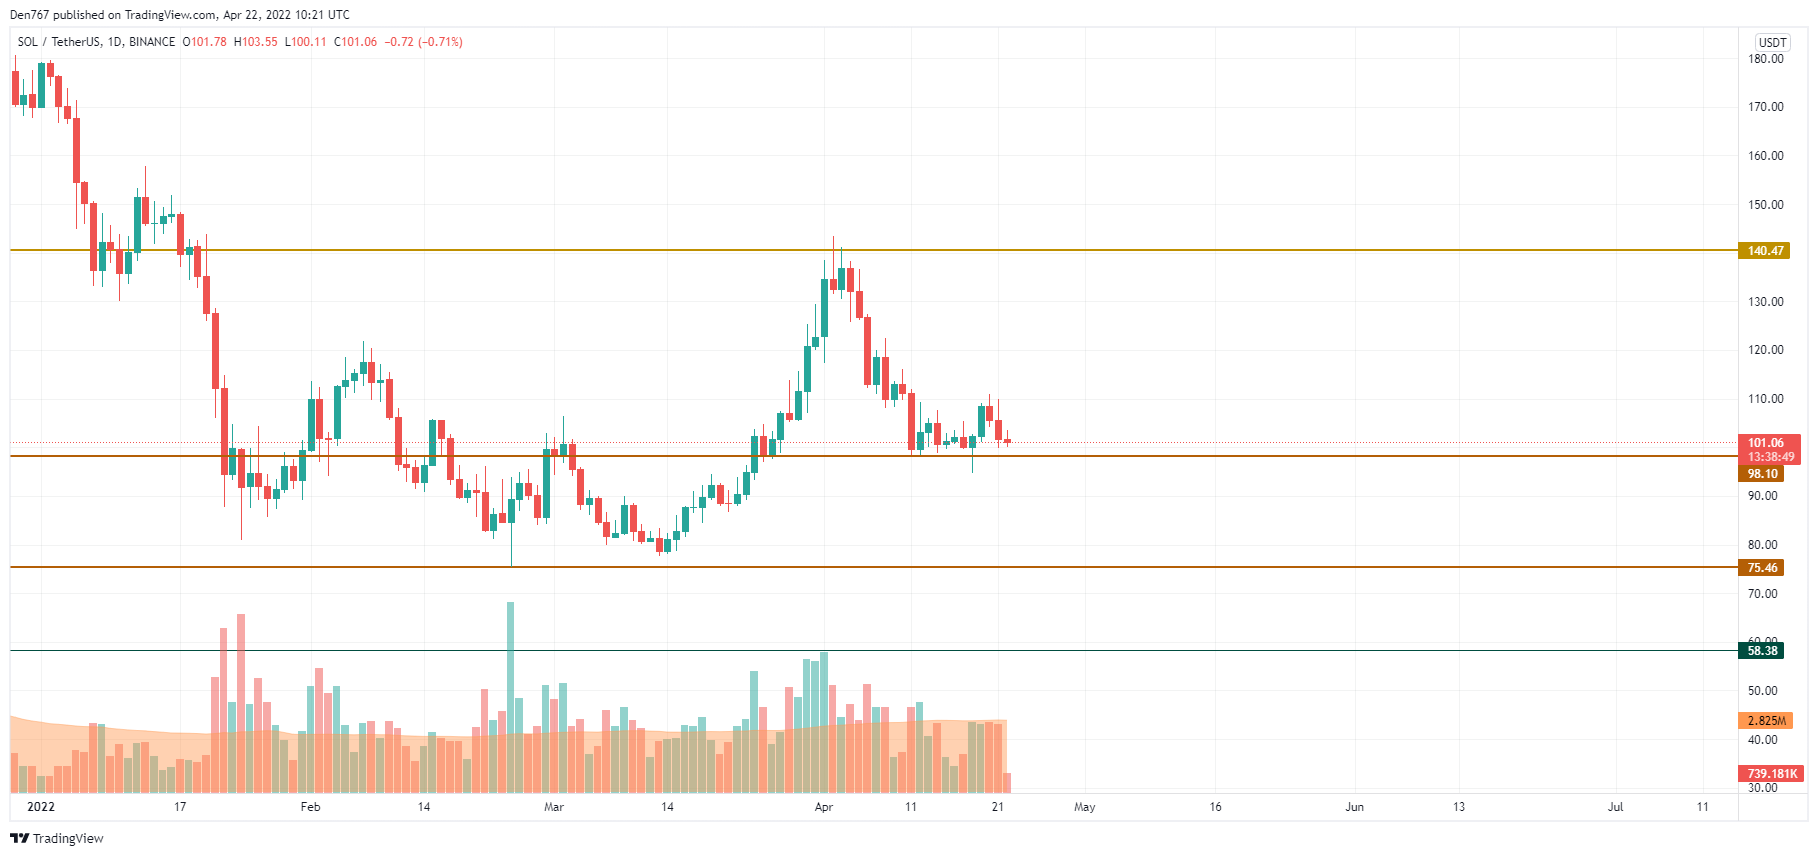
Solana (SOL) is trading similar to Bitcoin (BTC) as it has also failed to keep the growth after the test of the $110 mark. If the daily candle fixes around $98, there is a chance to see the sharp decline below $90 within the nearest days. Such a scenario is relevant until the end of the current week.
SOL is trading at $101.91 at press time.
LUNA/USD
LUNA has fallen the least from the list today with a decline of 2.22%.
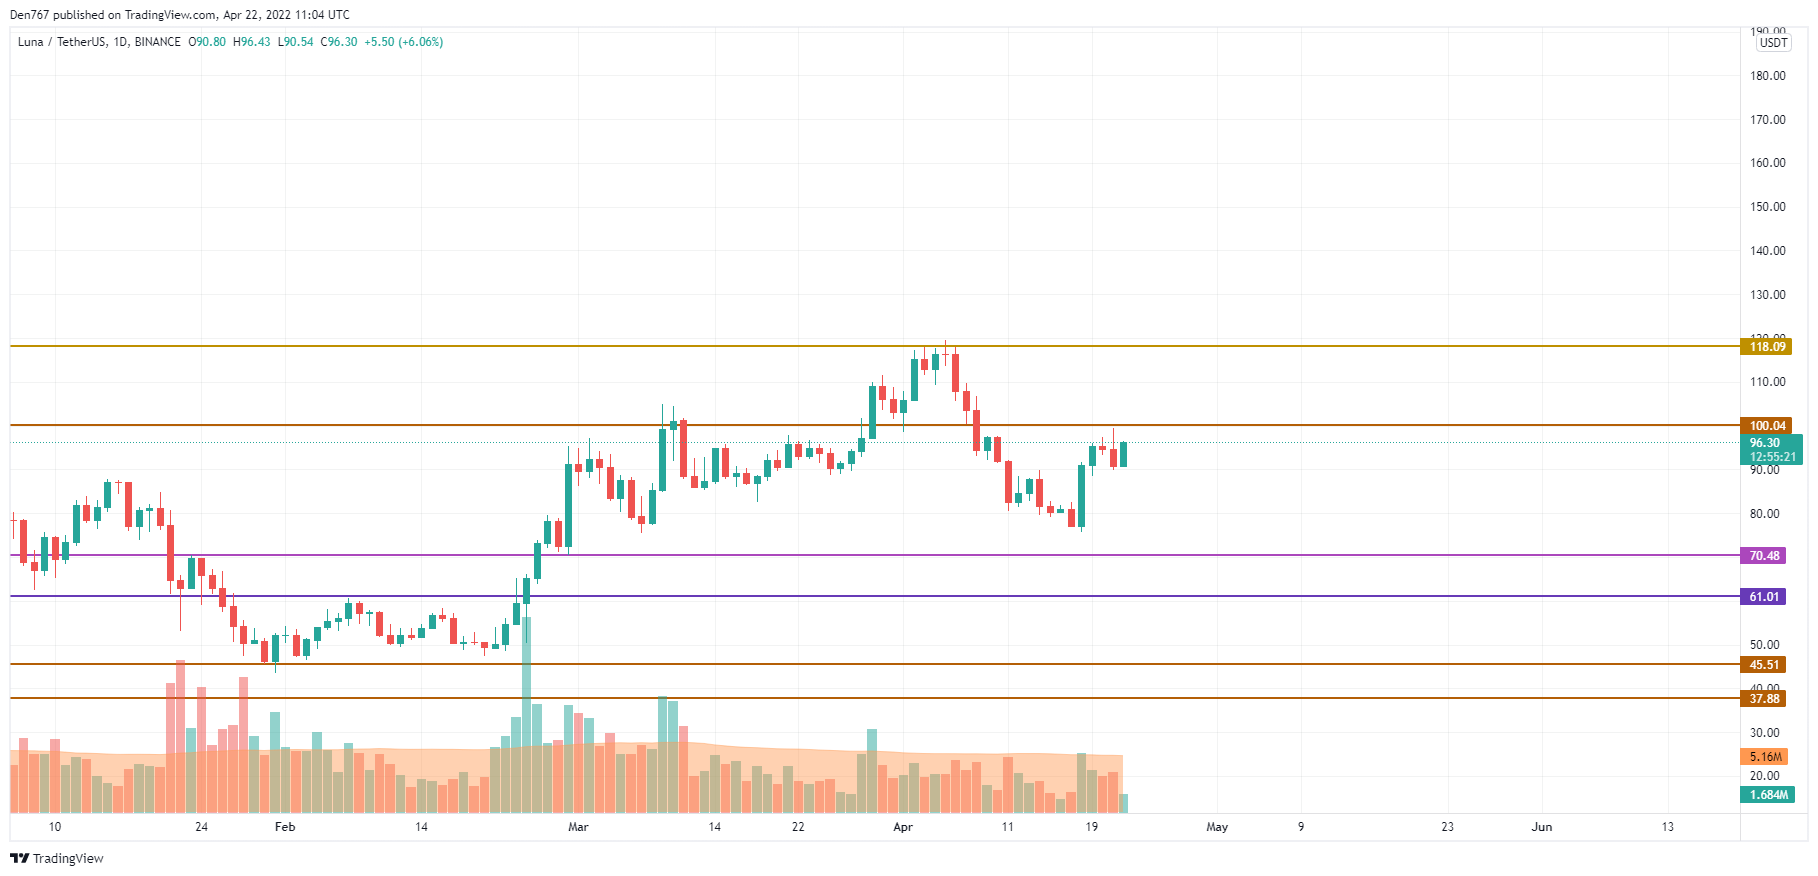
On the daily chart, the price of LUNA is coming back to the resistance at $100. This mark is crucial for bulls in terms of mid-term growth as its breakout may lead to the test of the next level at $118. However, if sellers continue their pressure and the rate comes back below $90, it may be a prerequisite for a further drop to the area of $80-$85.
LUNA is trading at $96.30 at press time.
 Dan Burgin
 U.Today Editorial Team