Disclaimer: The opinions expressed by our writers are their own and do not represent the views of U.Today. The financial and market information provided on U.Today is intended for informational purposes only. U.Today is not liable for any financial losses incurred while trading cryptocurrencies. Conduct your own research by contacting financial experts before making any investment decisions. We believe that all content is accurate as of the date of publication, but certain offers mentioned may no longer be available.
As it trades just above $96,000, up 2.14% on the day, Bitcoin is getting close to a turning point. It is currently in a technical vacuum following a robust recovery in late April; neither significant resistance nor obvious support is located right above it or below. A significant volatility spike that determines the market's course for weeks or even months frequently precedes this kind of price structure.
If momentum returns, Bitcoin has the potential to soar higher because there are not any nearby resistance zones. However, the opposite is also true: the asset is extremely susceptible to steep declines in the event that bulls lose control because there is not an immediate support buffer until approximately $89,000.
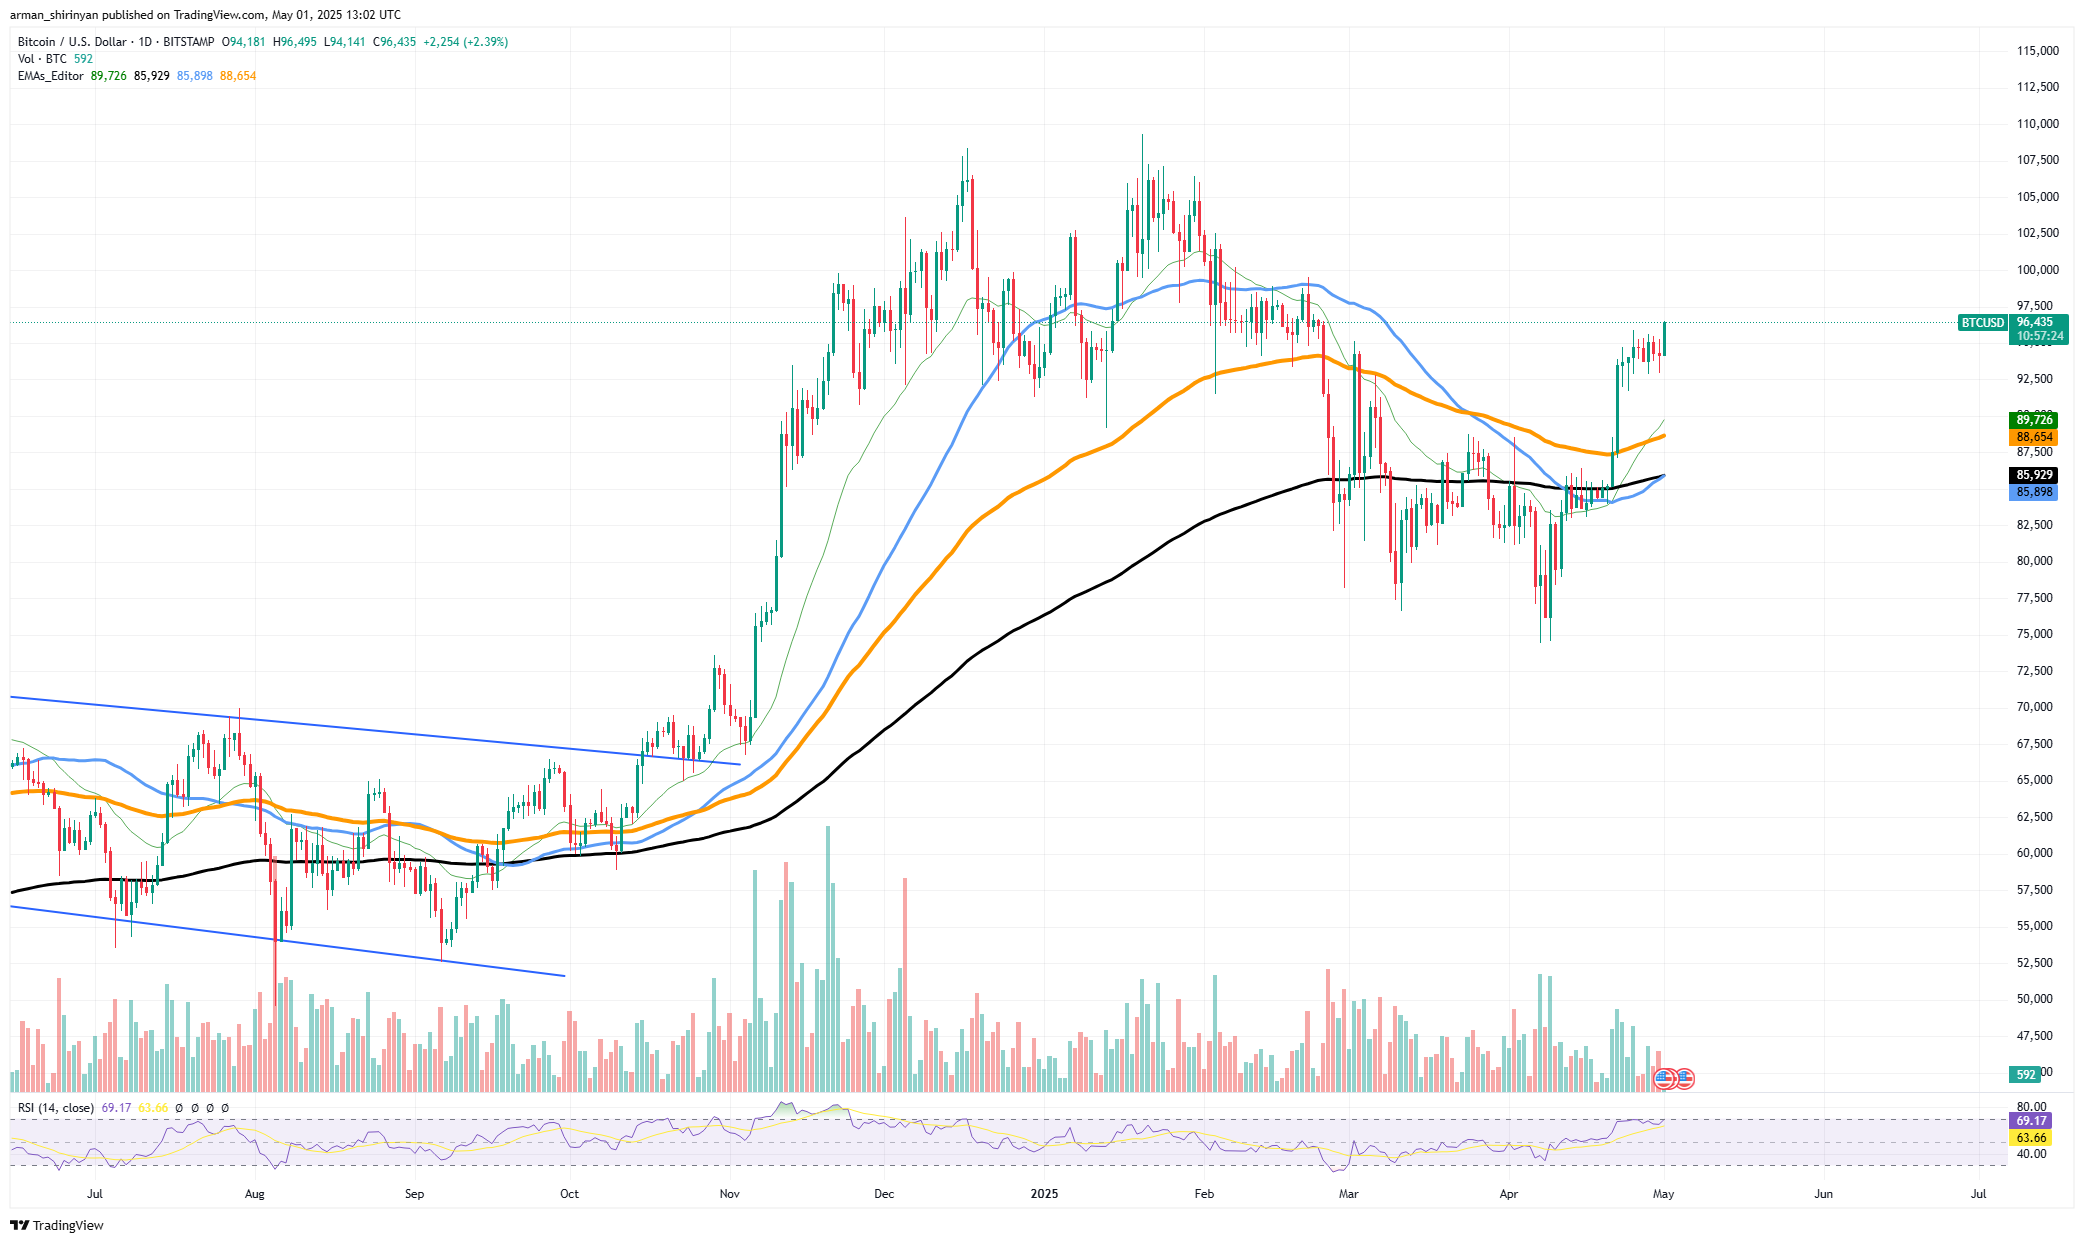
With the RSI at 68, which is getting close to the overbought threshold, momentum is still strong but may be peaking. But the volume remains low, which is a warning sign. In the absence of increased participation, this breakout could turn into a bull trap. The course of the subsequent volatility spike will determine everything that happens next.
A new leg up that might target the psychological $100,000 level and beyond could be started by a clean break above $97,000 with high volume. Alternatively, a collapse below the $93,000-$92,000 range would probably lead to $89,000 or even lower, indicating the end of this rally and possibly igniting a general market correction.
Bitcoin is perched on the edge of a tight market. Since no safety net is in sight, the next big move — up or down — will not merely be another leg; rather, it will determine the framework for the cycle's subsequent phase. Hold on tight because this level of calm is short-lived.
XRP is ready
As it tests the upper limit of a descending channel that has characterized its price action since January 2025, XRP is poised for a significant move. Just below the $2.40 resistance, a crucial level that, if broken, could lead to a volatility breakout, the asset is currently trading at about $2.37, up 2.12% for the day.
With declining volume suggesting that a breakout — or breakdown — is imminent, the chart clearly shows that XRP is compressing toward the tip of a wedge following months of lower highs and lower lows. The fact that XRP has surpassed all three major moving averages, the 50, 100 and 200 EMA, and that they are now converging around the $2.20 region, is encouraging for bulls.

This confluence serves as a dynamic floor of support. Because the asset is not yet overbought, the RSI remains neutral at 55, providing it with room to rise sharply. The volume is still low, but given how swiftly XRP moves when sentiment changes, any increase in buying interest around $2.40 could spark a quick rally to the $2.80-$3.00 region.
Technically speaking, XRP is acting in a positive way. It made a clean recovery from the April bottom of the wedge and is now marking higher lows, which suggests that buyers are intervening more forcefully. The consolidation that is occurring close to the top of the descending channel is an indication of increasing pressure, not weakness.
Strong volume and a clean breakout above $2.40 would validate the trend reversal and probably signal the start of a period of increased volatility and quick gains. On the other hand, if the 200 EMA is not held above $2.20, it may retest around $1.98.
Ethereum eyes recovery
With its strong 3.14% daily gain, Ethereum has pushed to $1,850, igniting cautious optimism about a wider recovery. This rally might not be as strong as it first appears, at least not yet, according to a closer examination of the market environment and chart structure. As of right now, ETH is trading just above its 50-day EMA, which it recently flipped into support.
Generally speaking a sustained breakout above this level is a bullish indication, particularly when combined with price consolidation close to the top. The 100 EMA, which is at $2,148, and the 200 EMA, which is at $2,469, represent the next important test. These moving averages could confirm a reversal and restore medium-term bullish momentum if they break cleanly. The problem is that the volume is not very impressive.

Although Ethereum's price is rising, the stability of this trend is undermined by the lack of robust buying activity. Significant ETH reversals in the past have been marked by spikes in volume and volatility, neither of which is present at the moment. This means that if the mood of the market changes or if Bitcoin begins to correct, the current move could be quickly reversed.
The RSI, which is at 59, indicates that ETH has some leeway before hitting overbought levels, but it might not mean much if volume does not increase. Although it is speculative at best without confirmation, this could be seen as quiet accumulation. Overall, the recovery is brittle even though Ethereum is displaying early indications of strength.
With increasing volume and volatility, ETH must decisively break through the 100 EMA for the market to fully embrace a bullish narrative. Until then, it would be more accurate to consider this move a cautious bounce rather than a complete trend reversal. Keep a close eye on the $2,150 zone; it will determine ETH's short-term destiny.
 Dan Burgin
 U.Today Editorial Team