
Disclaimer: The opinions expressed by our writers are their own and do not represent the views of U.Today. The financial and market information provided on U.Today is intended for informational purposes only. U.Today is not liable for any financial losses incurred while trading cryptocurrencies. Conduct your own research by contacting financial experts before making any investment decisions. We believe that all content is accurate as of the date of publication, but certain offers mentioned may no longer be available.
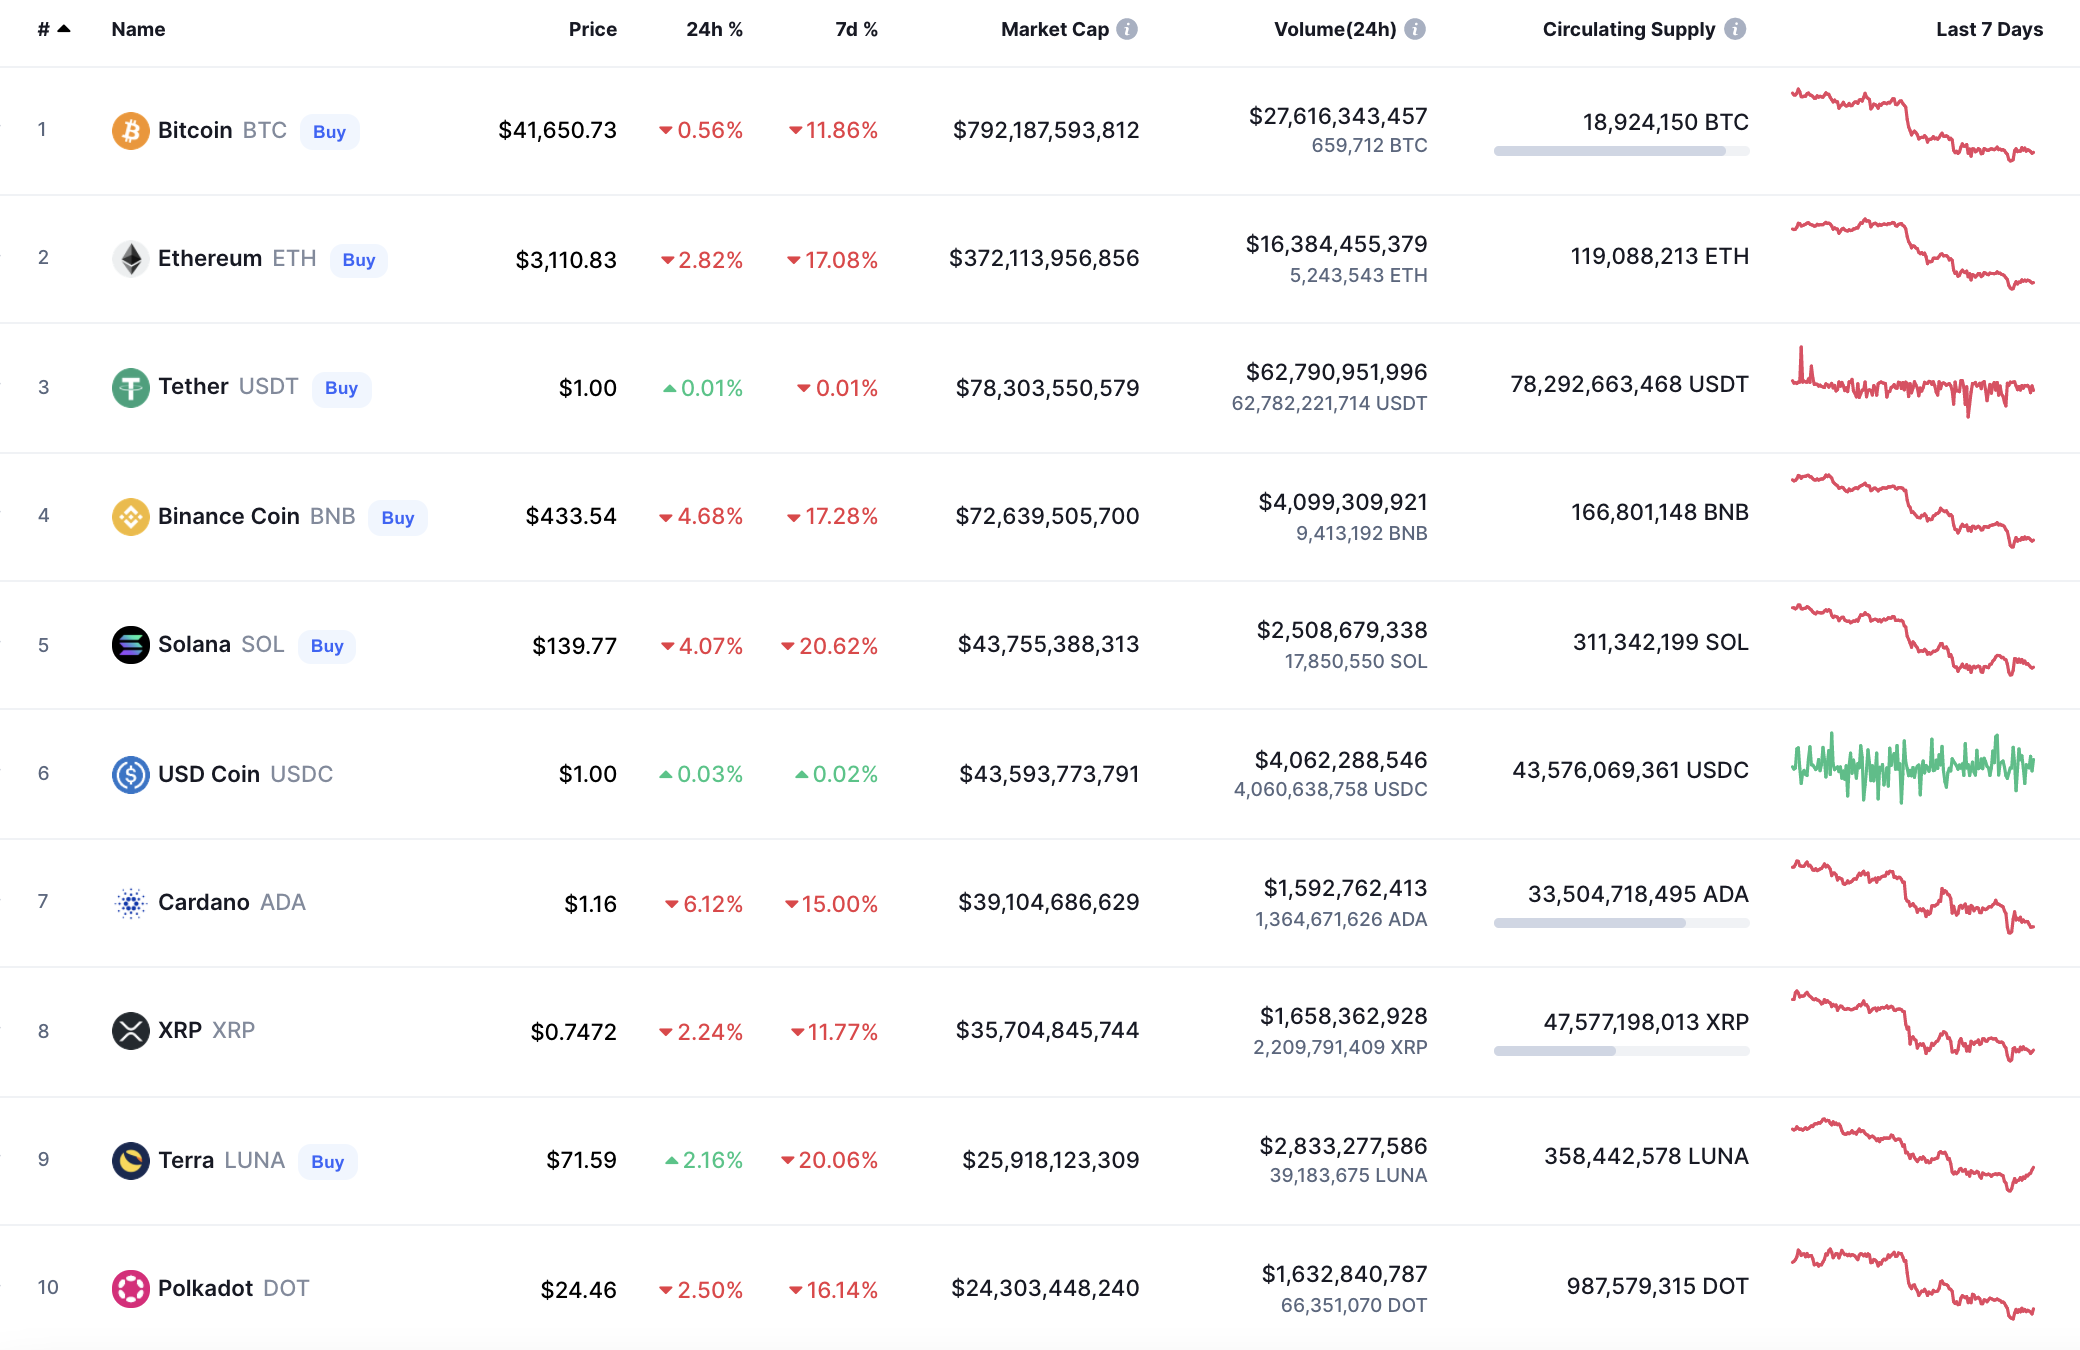
The last day of the week has turned out to be bearish for the cryptocurrency market as most of the coins are in the red zone. LUNA is the only exception to the rule, rising by 2%.
BTC/USD
The rate of Bitcoin (BTC) has gone down by 11% over the last week.
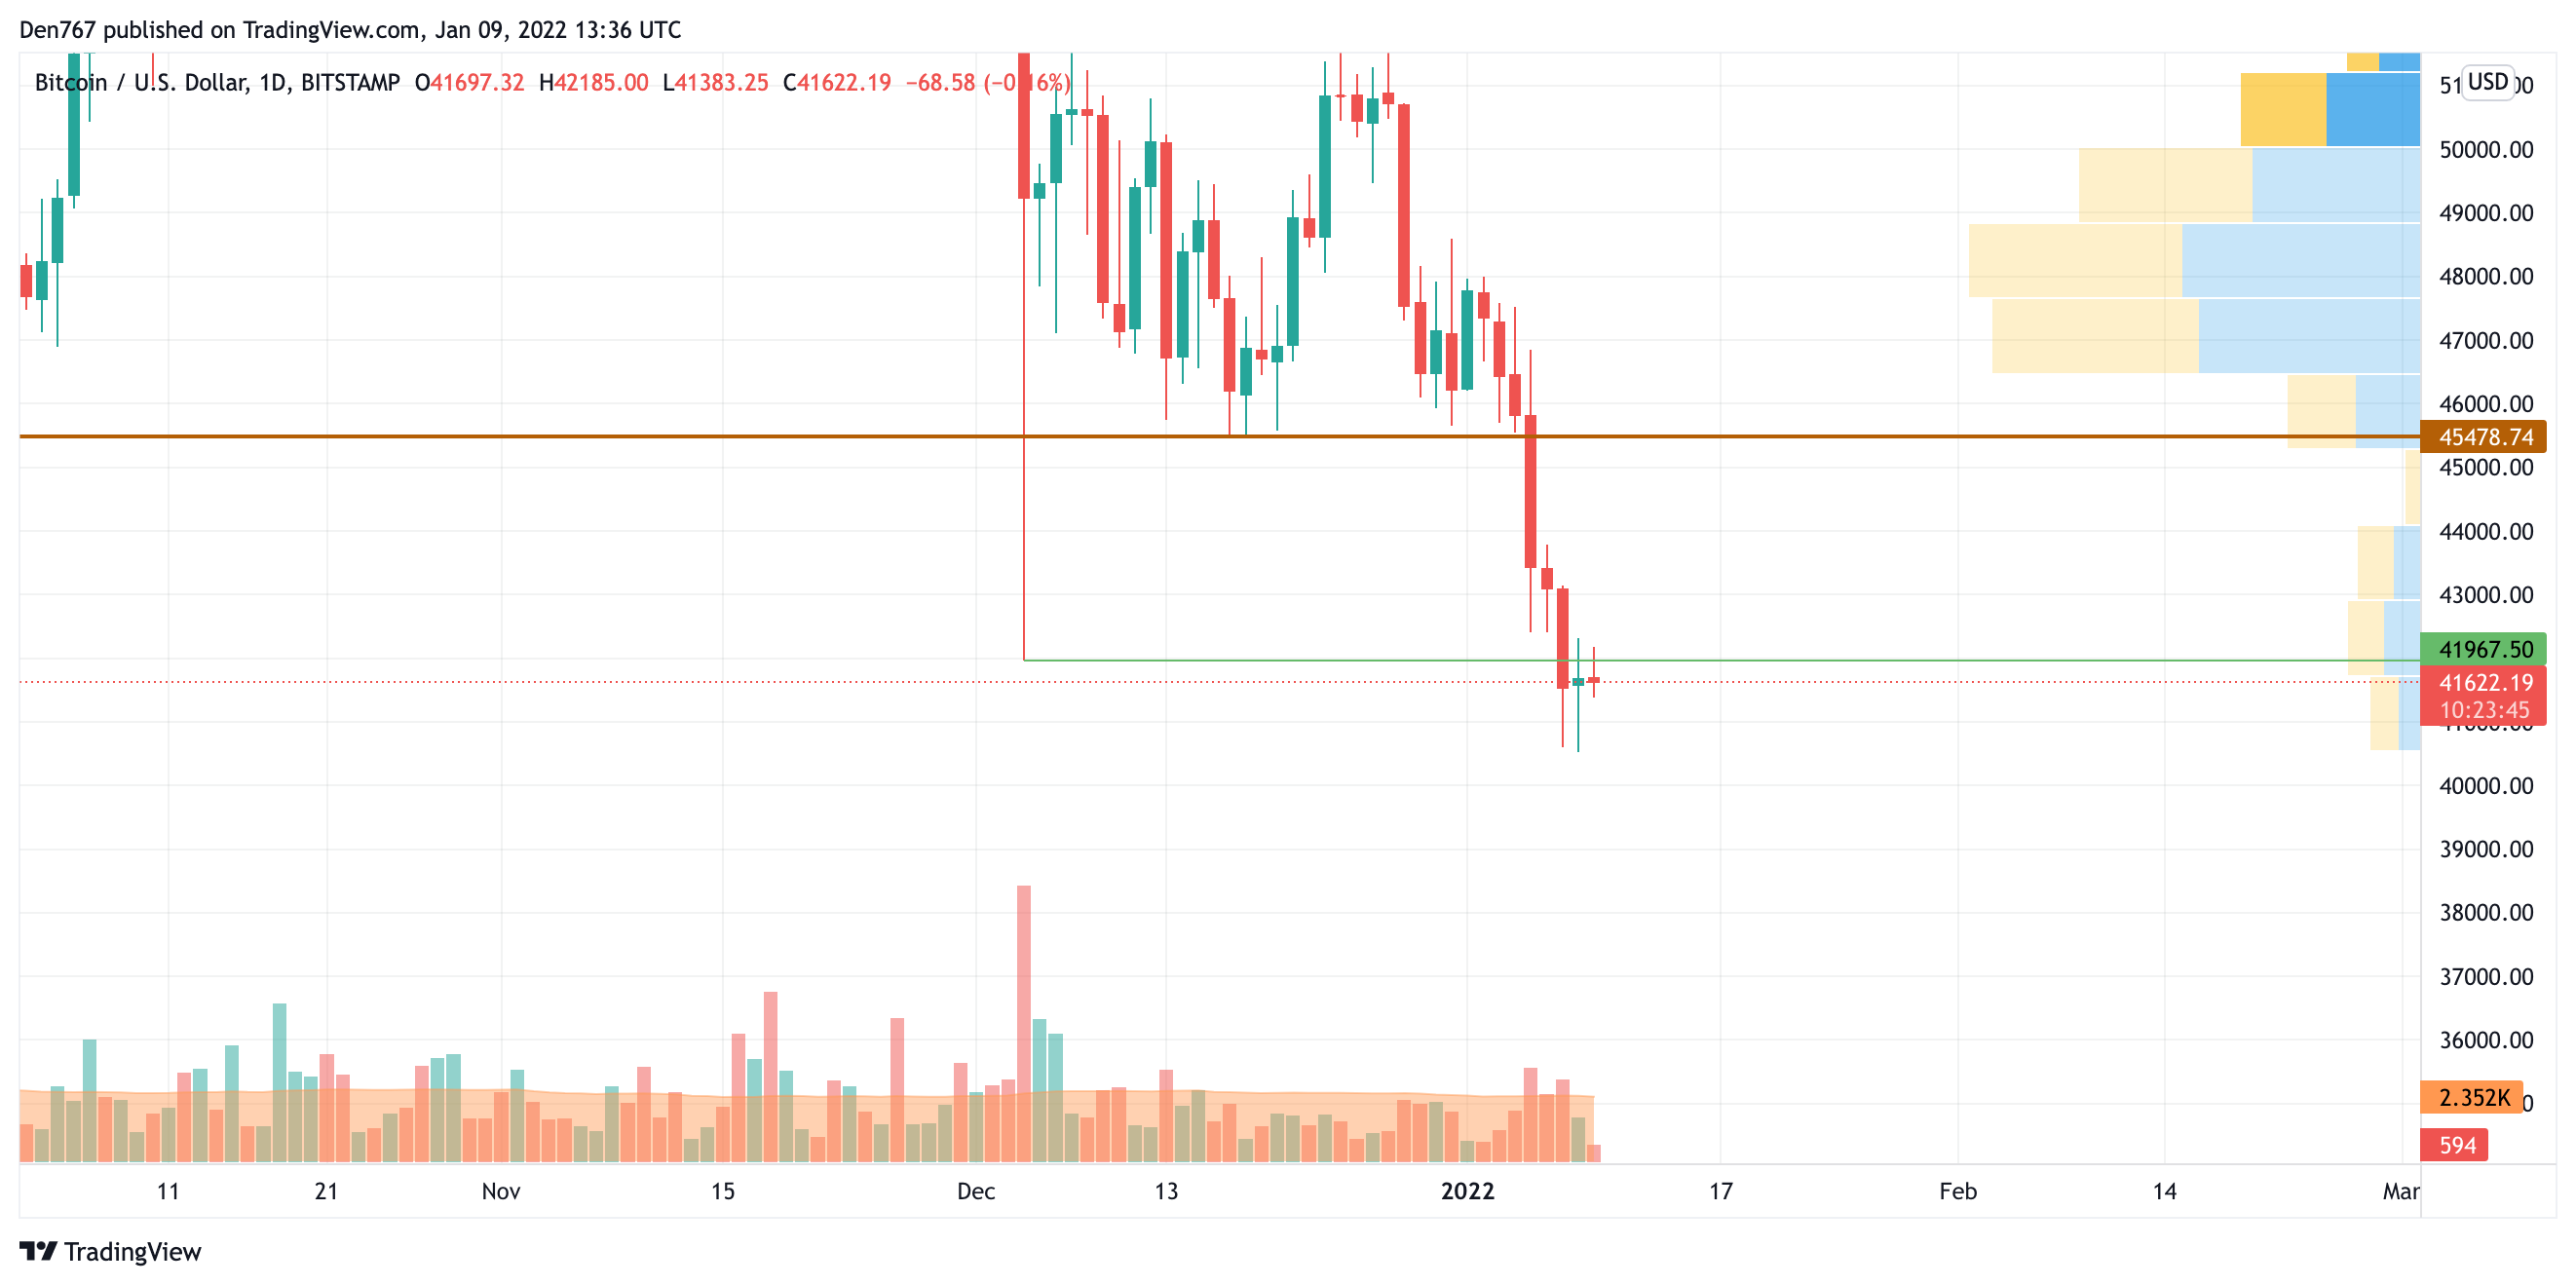
Bitcoin (BTC) is trading around the support level of $41,967 on the daily chart.

If the bears' pressure continues and the rate fixes below this mark, one may expect the leading crypto to locate around the psychological area of $40,000 next week.
Bitcoin is trading at $41,622 at press time.
XRP/USD
XRP has lost more than Bitcoin (BTC) with a price change of -2.24% since yesterday.
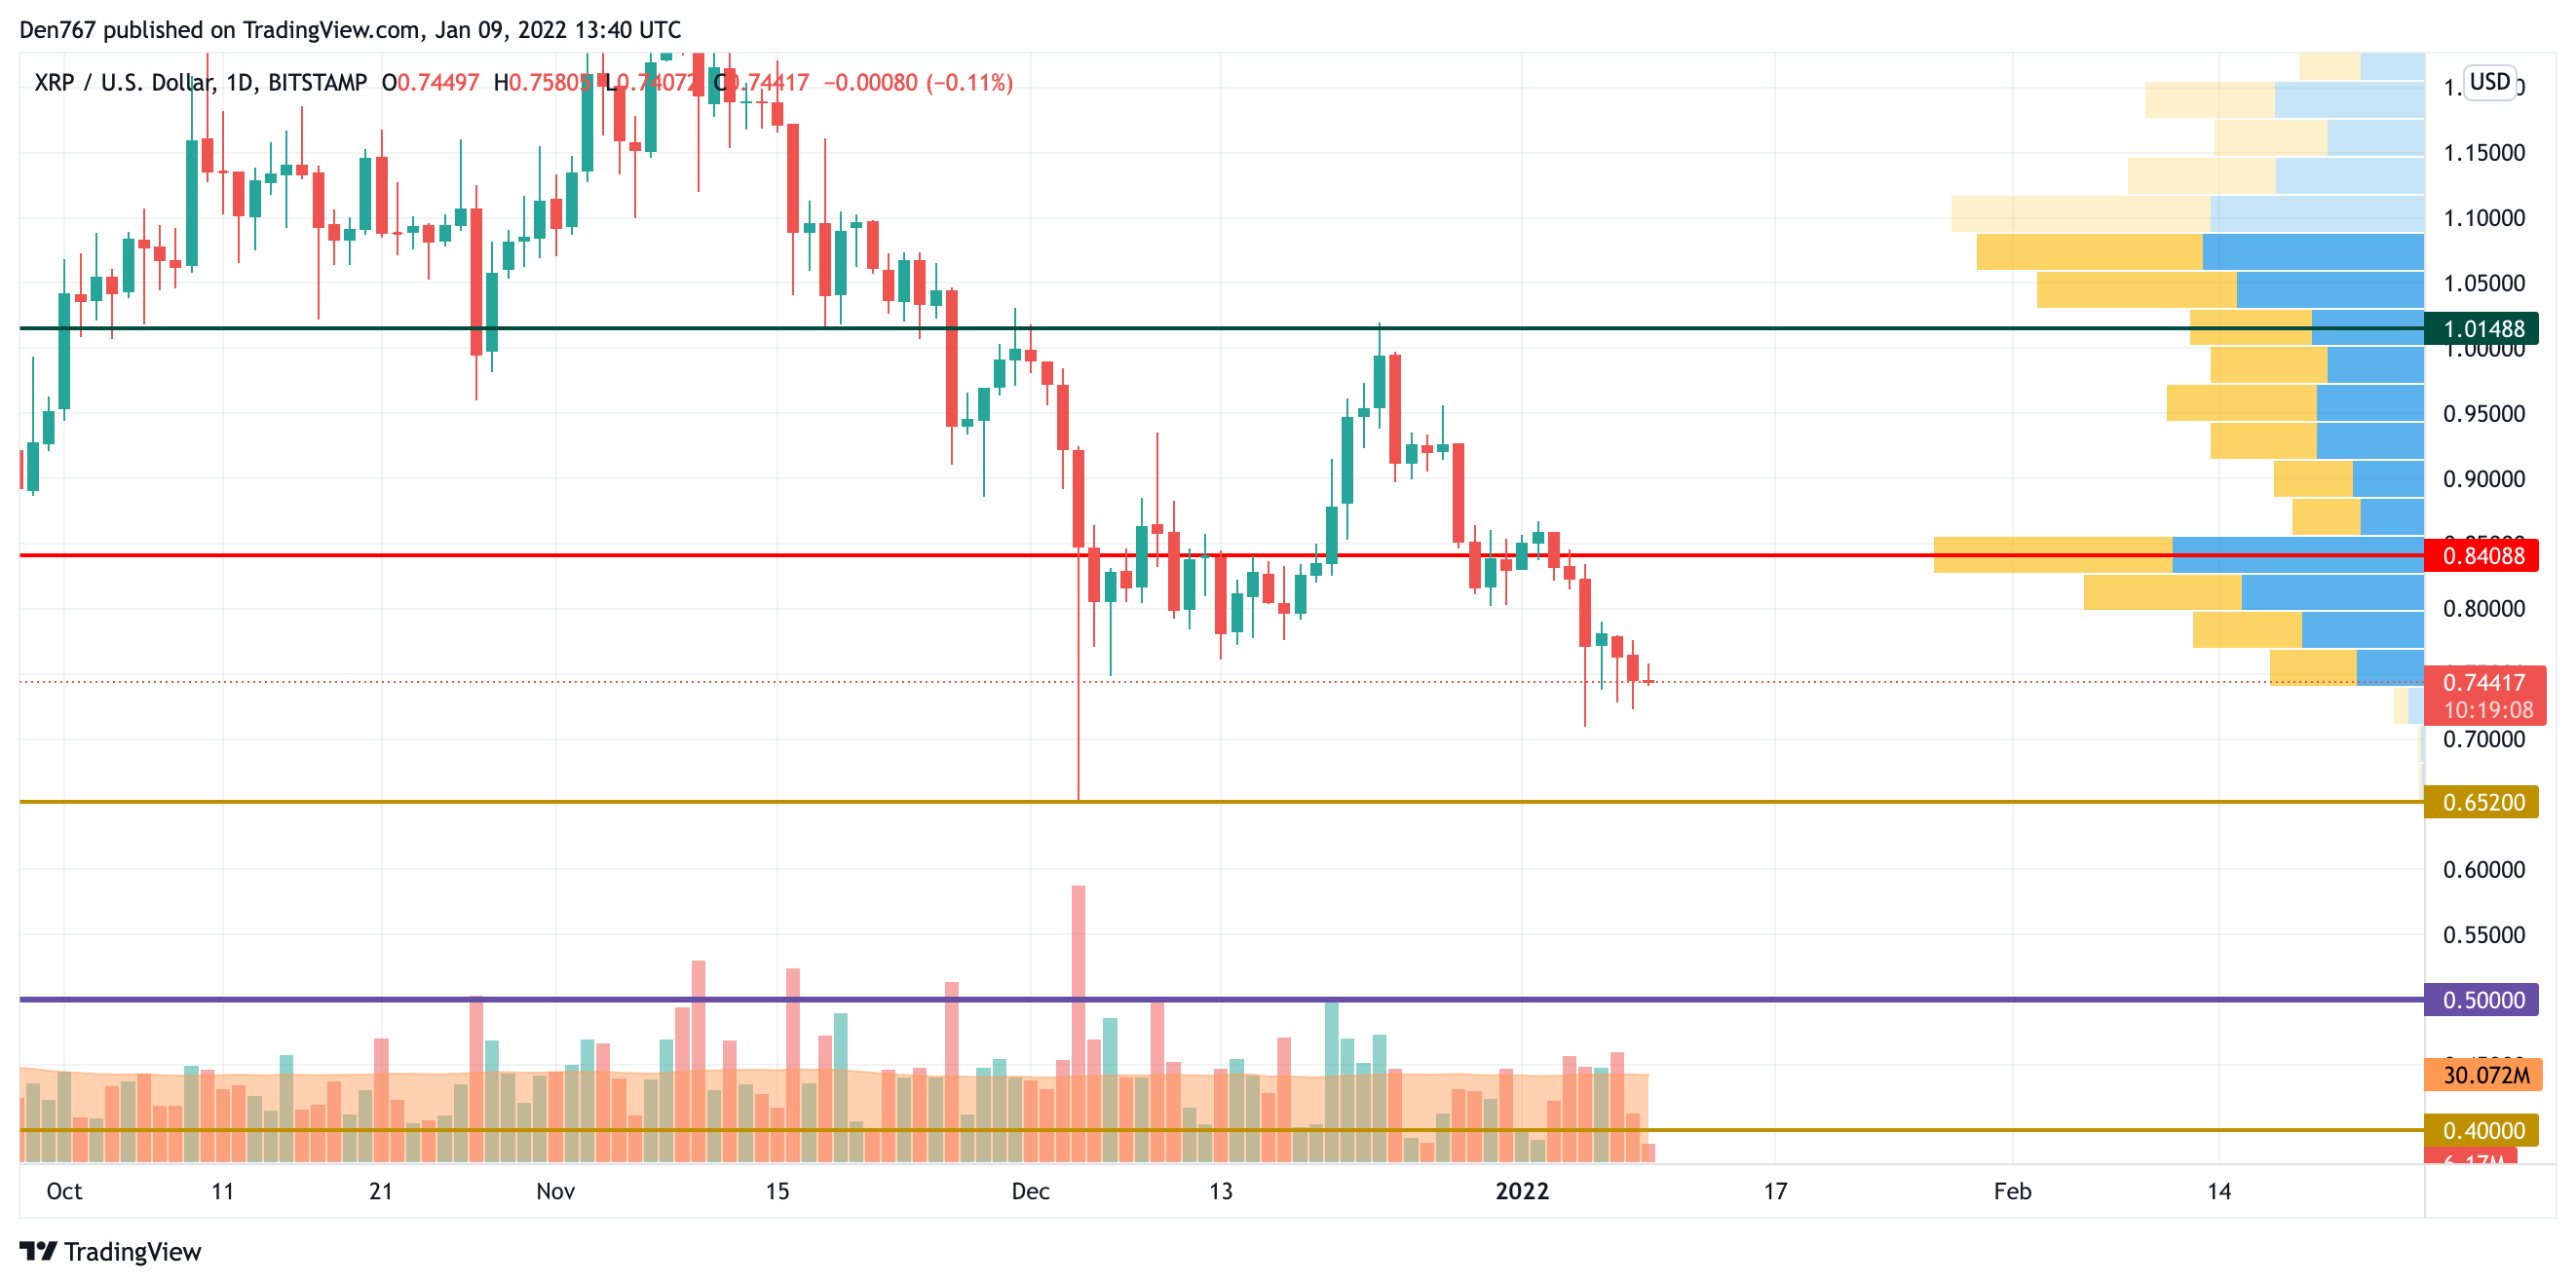
XRP remains under bears' control as bulls could not seize the initiative after the test of the liquidity zone around $0.84. If the situation does not change, the fall may lead the rate of XRP to the support level at $0.652 soon.
XRP is trading at $0.7441 at press time.
AVAX/USD
Avalanche (AVAX) is the biggest loser today in terms of weekly price change, with a fall of 26%.
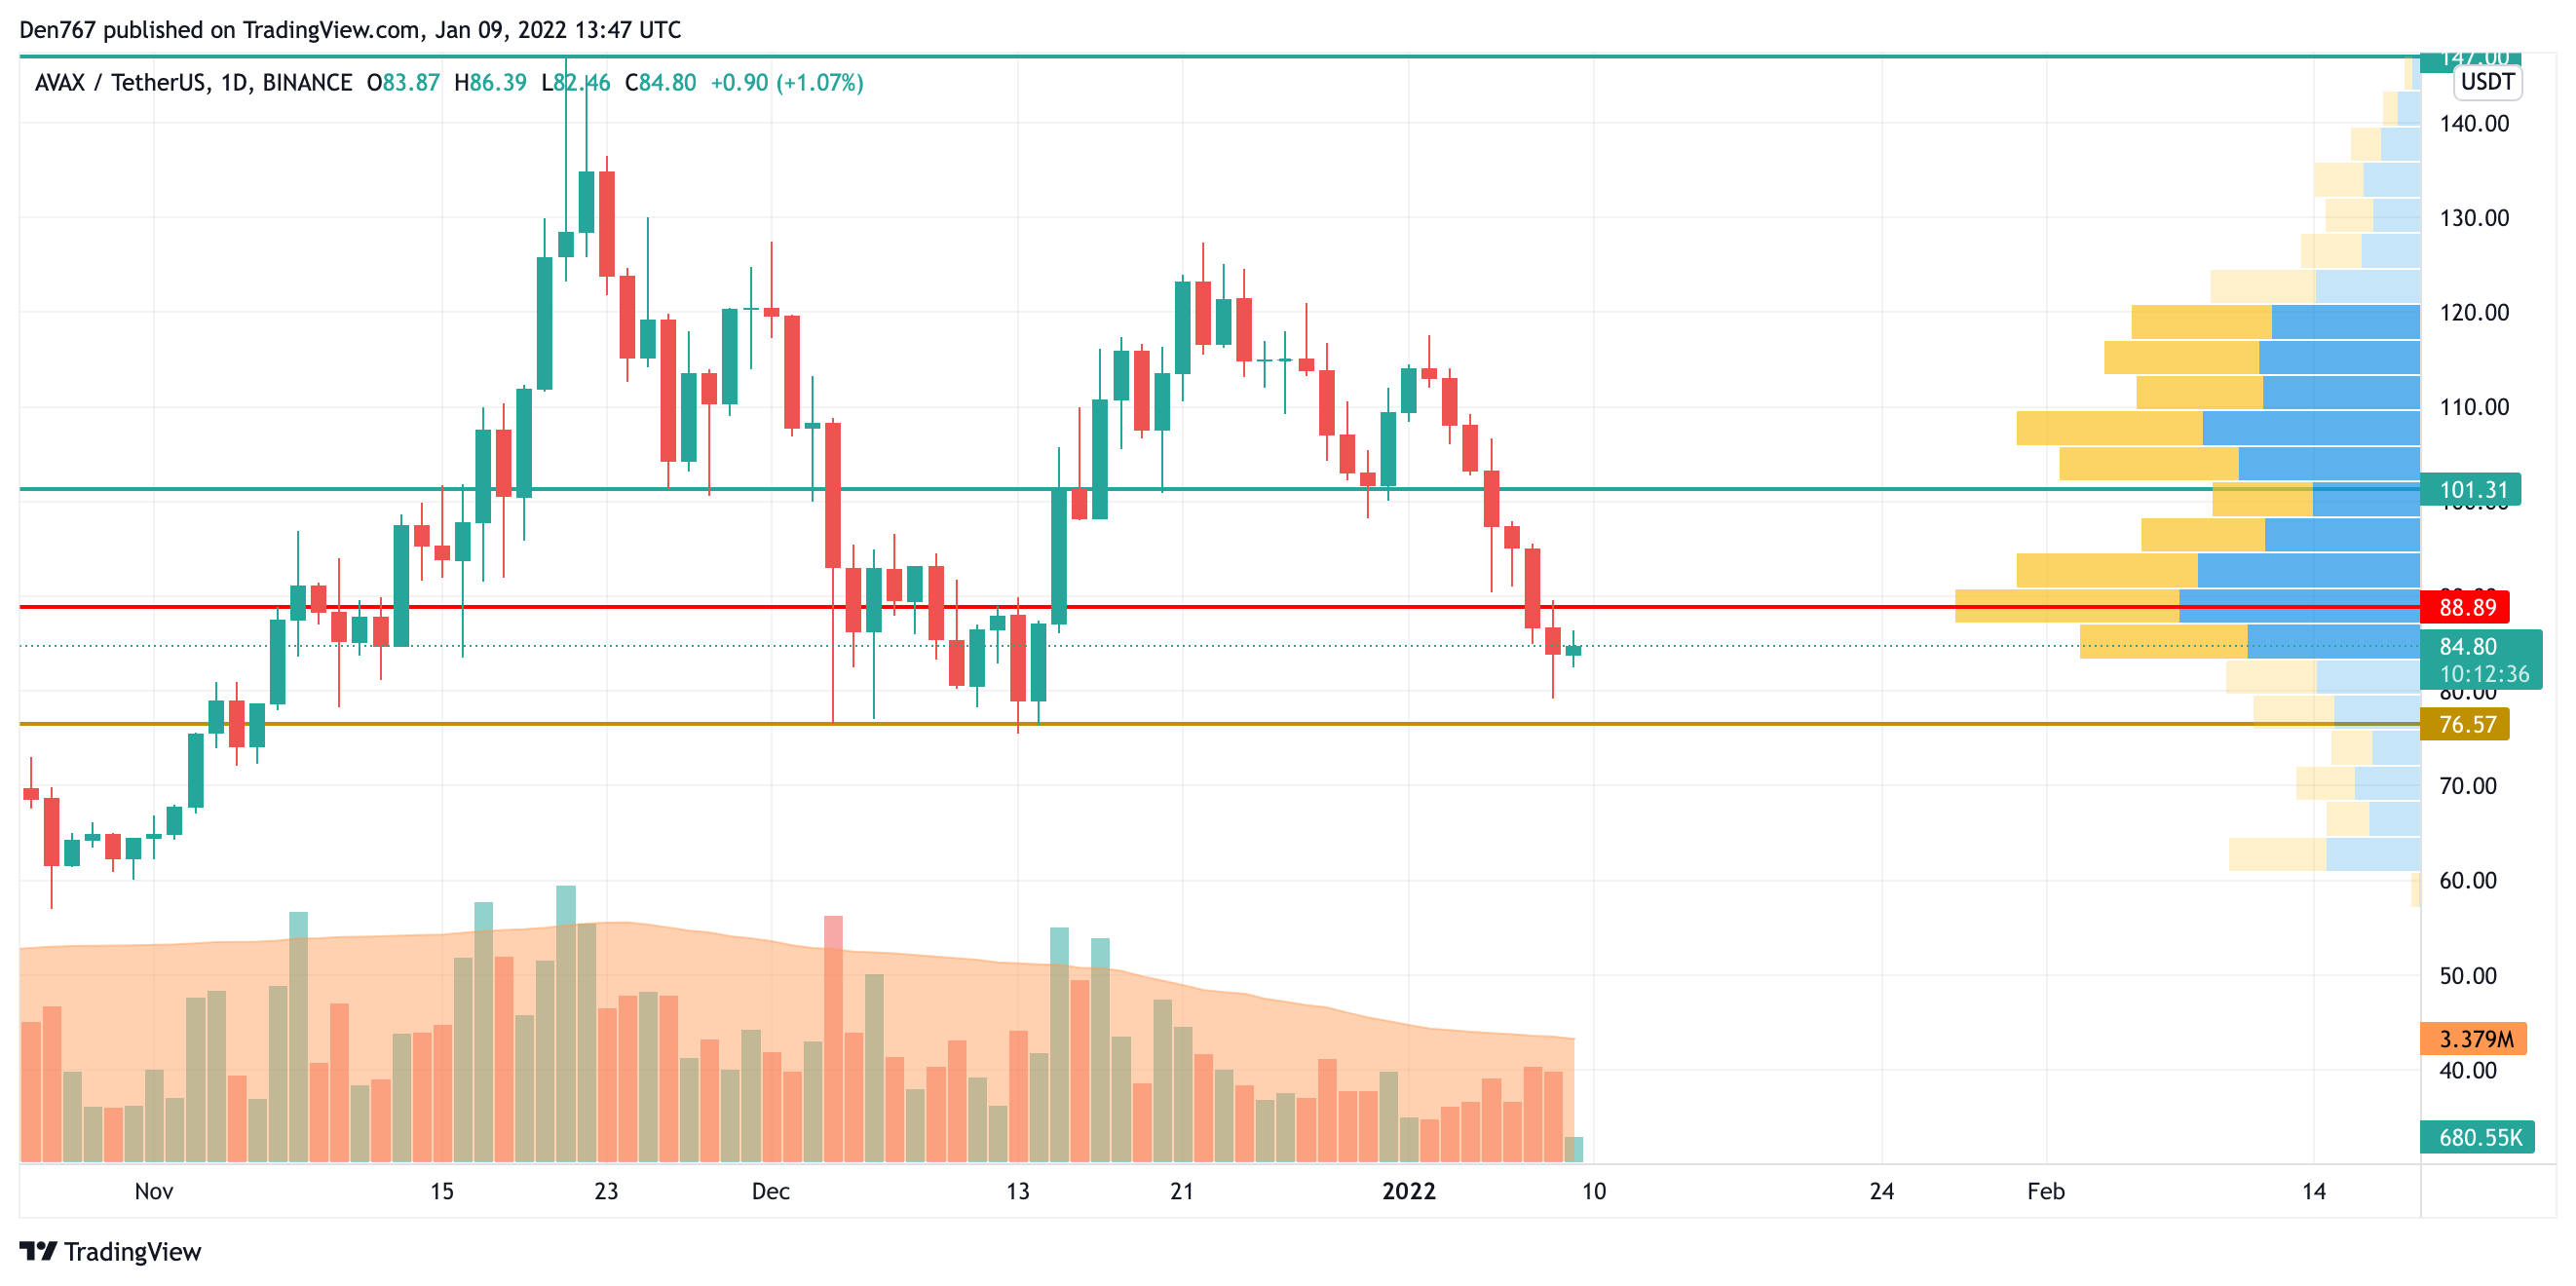
On the daily chart, AVAX has almost tested the support level at $76.57, followed by a bounceback. However, the buying trading volume is low, which means that there are low chances for a bullish trend reversal.

In this case, the most likely scenario is sideways trading between $80 and $90.
AVAX is trading at $84.80 at press time.
DOT/USD
Polkadot (DOT) is also following the drop of other coins, declining by 2.50%.
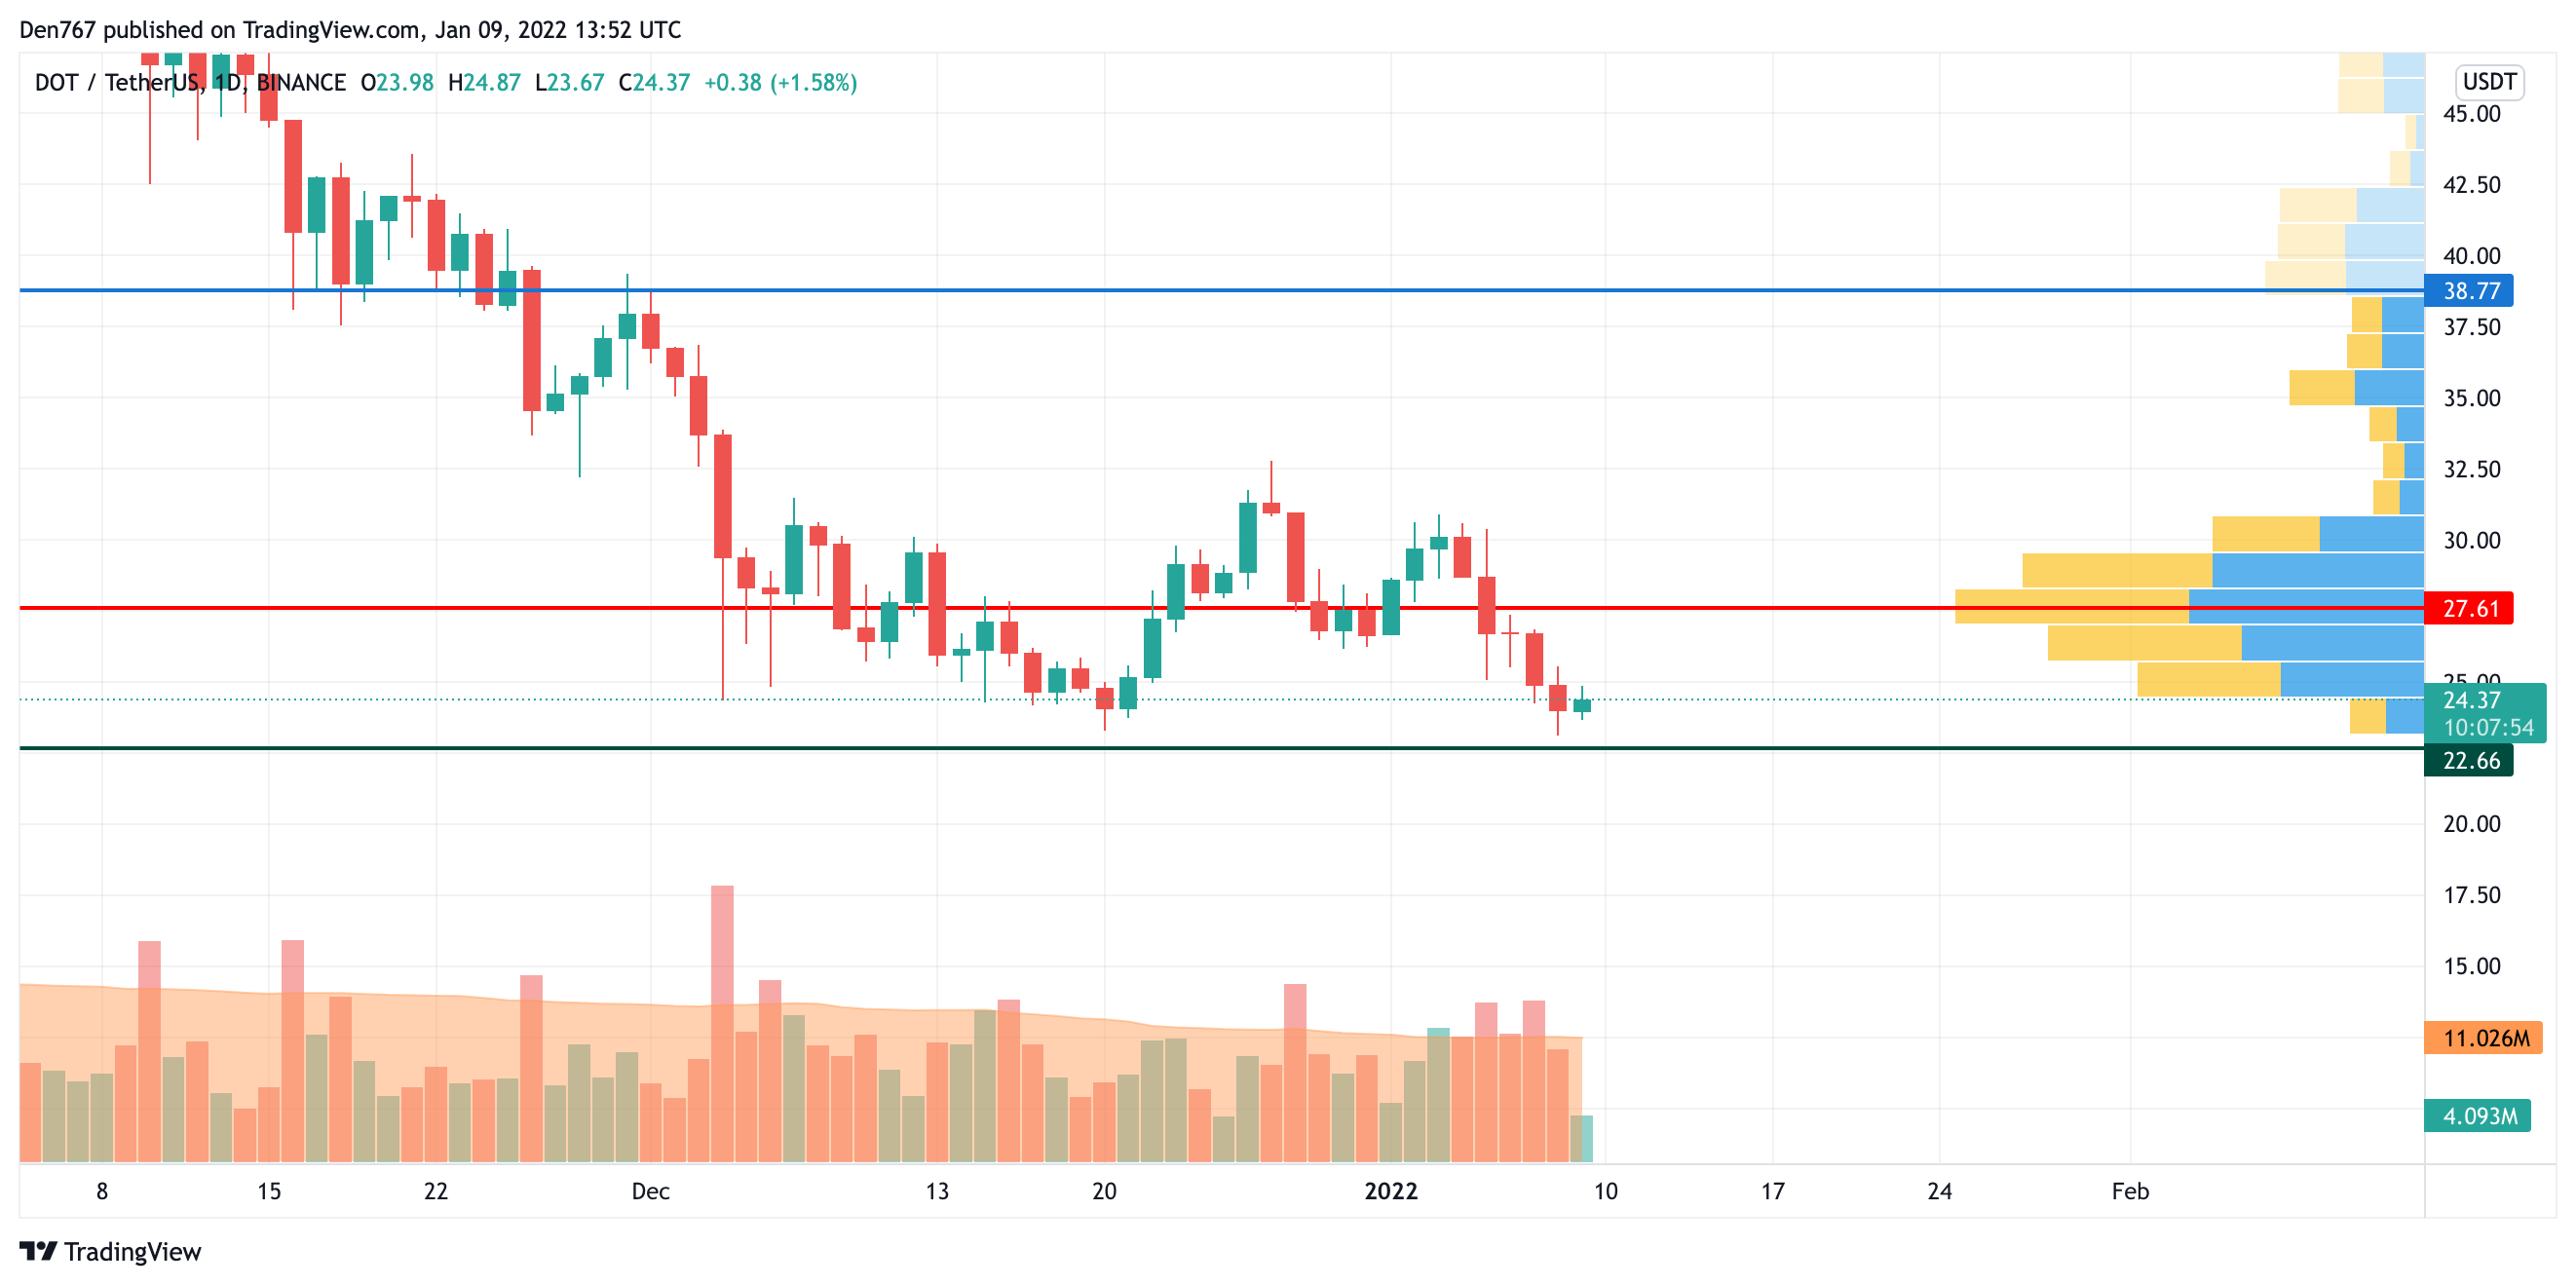
From the technical point of view, DOT is trading similarly to AVAX as it has also almost tested the support zone. Until the rate is above $22.66, bulls have the chance to get back in the game return the rate to the nearest resistance at $27.61. If they fail to do so, there is a possibility to see a breakout of the support and a sharp drop to $20.
DOT is trading at $24.35 at press time.
 Dan Burgin
 U.Today Editorial Team