Disclaimer: The opinions expressed by our writers are their own and do not represent the views of U.Today. The financial and market information provided on U.Today is intended for informational purposes only. U.Today is not liable for any financial losses incurred while trading cryptocurrencies. Conduct your own research by contacting financial experts before making any investment decisions. We believe that all content is accurate as of the date of publication, but certain offers mentioned may no longer be available.
Bears are keeping the pressure on; however, some coins have come back to the green zone.
BTC/USD
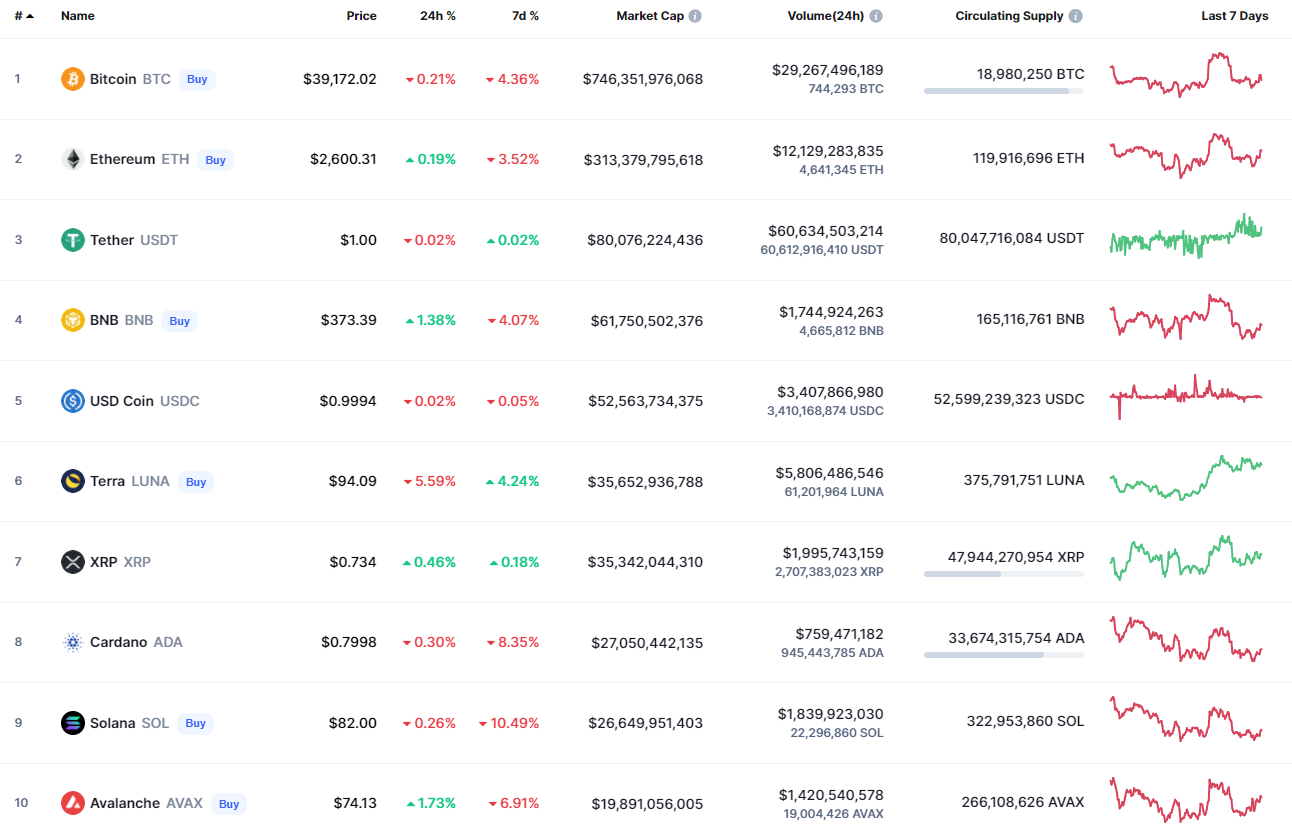
The rate of Bitcoin (BTC) has declined by 0.35% over the past 24 hours.
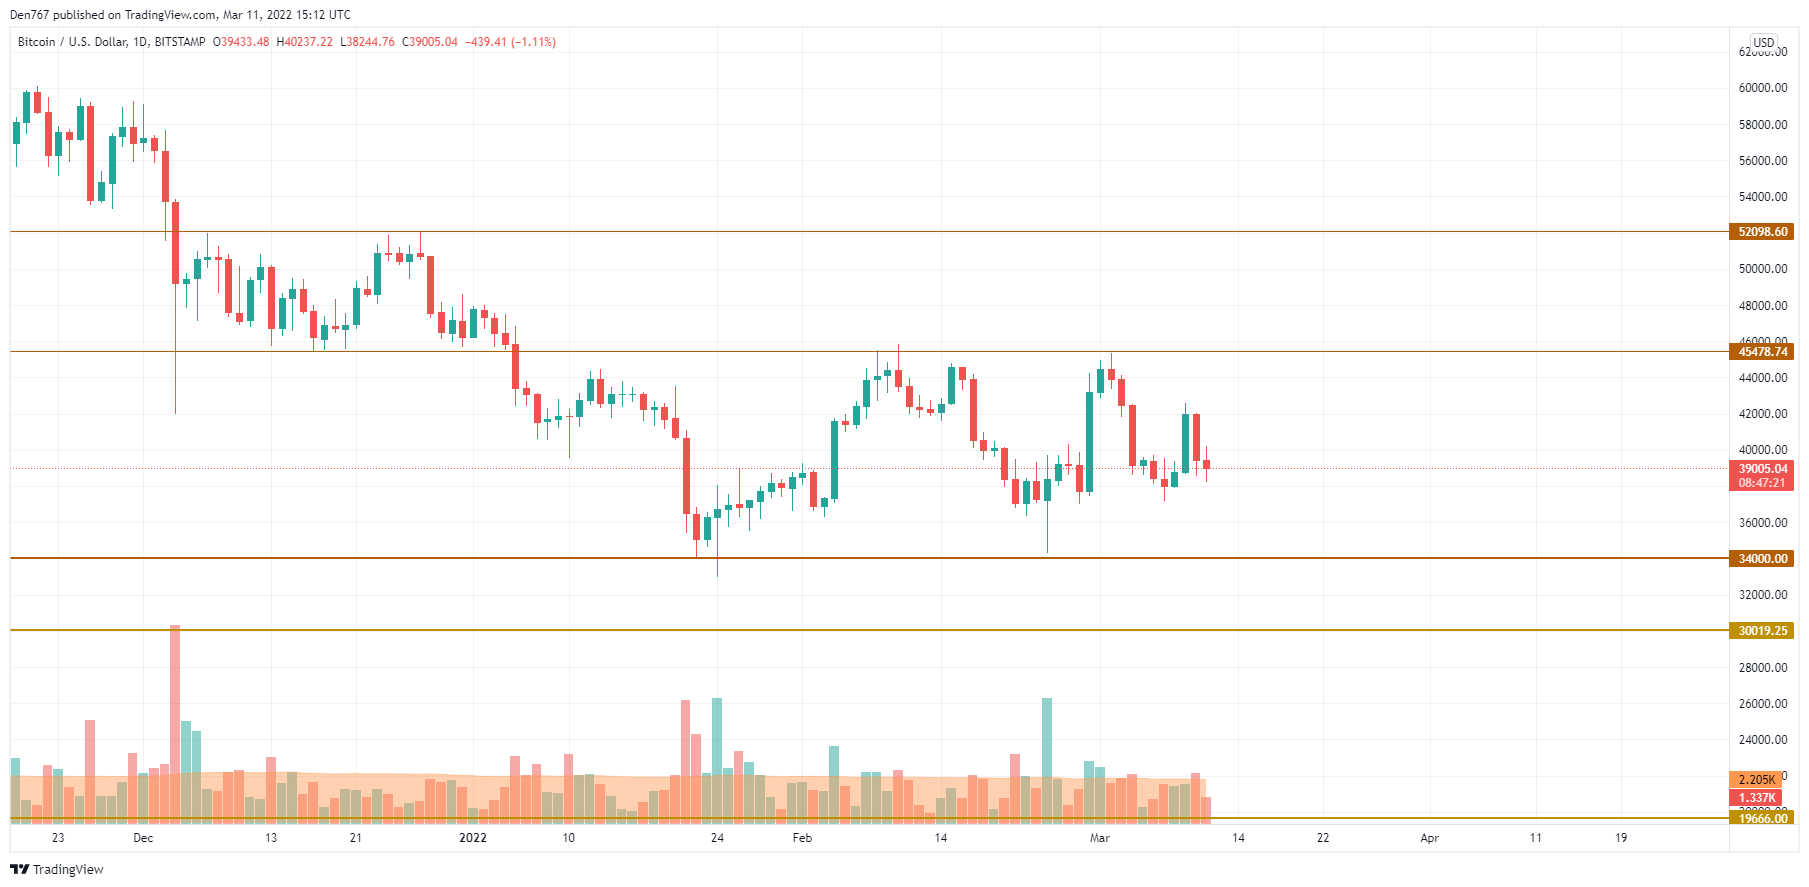
On the daily chart, Bitcoin (BTC) is fighting for the $39,000 mark against a high trading volume. From the technical point of view, the rate keeps trading in a wide range, accumulating power for a further sharp move.
However, if the decline continues to the $38,000 level, there is a possibility of seeing the price decrease to the zone of $34,000-$35,000 shortly.
Bitcoin is trading at $39,045 at press time.
DOGE/USD
DOGE is the biggest loser from the list today as the drop has accounted for 0.45% since yesterday.
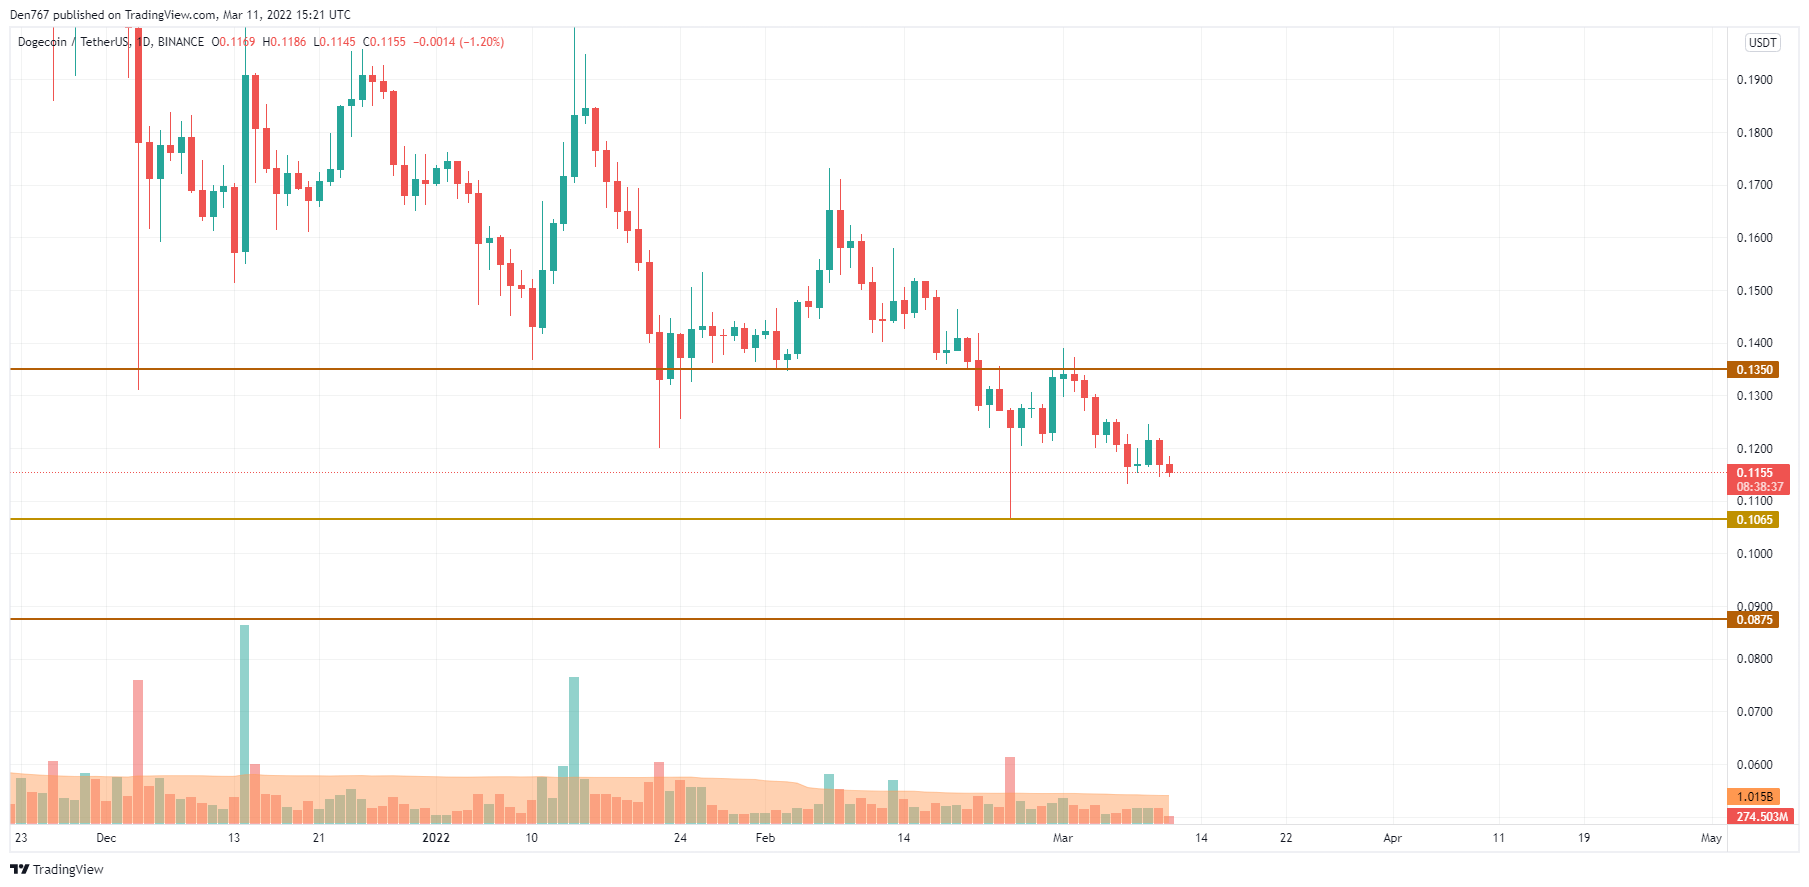
DOGE has continued its drop after it could not fix above the $0.12 mark. Bears are keeping the pressure on against the declining trading volume. If nothing changes, there is a chance to see the test of the support level at $0.1065 once again. Such a scenario is relevant until the end of the week.
DOGE is trading at $0.1158 at press time.
SHIB/USD
SHIB is the only coin whose rate is in the green zone. It has risen by 0.30% over the past day.
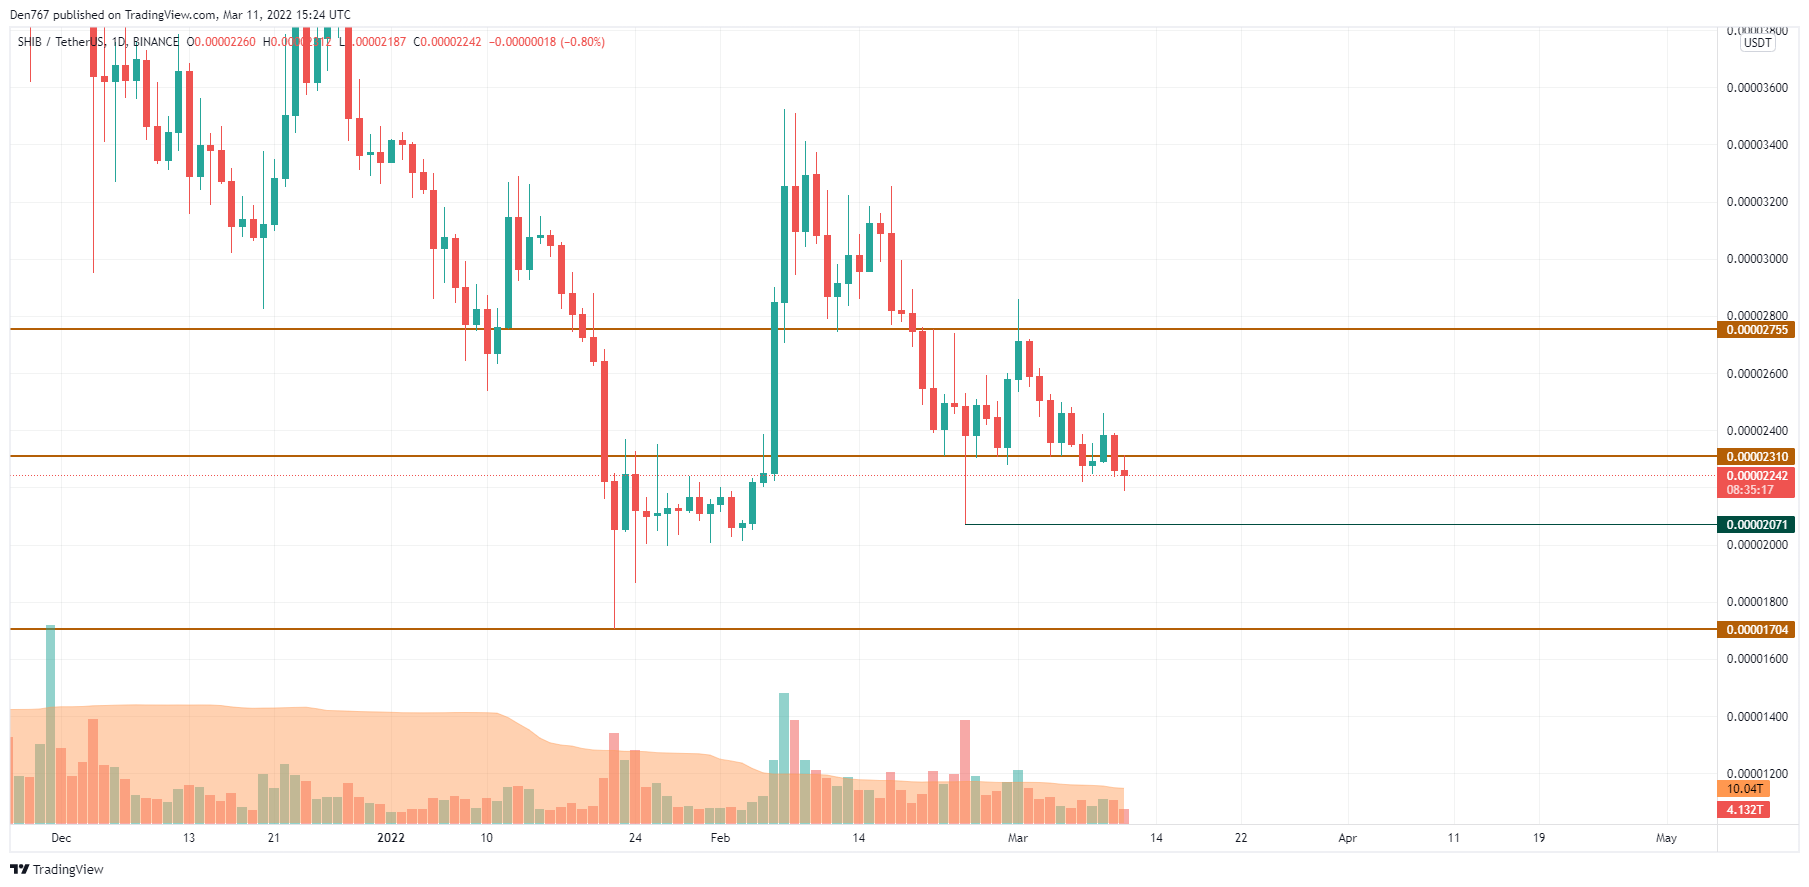
Despite the rise, SHIB has gone below the important support level at $0.00002310. If buyers cannot seize the initiative and return the price to the bullish area, the decline may lead the rate to the next vital level at $0.00002071. All in all, the mid-term price action remains bearish as long as buyers cannot get back to the zone around $0.000024.
SHIB is trading at $0.0000224 at press time.
 Dan Burgin
 U.Today Editorial Team