Disclaimer: The opinions expressed by our writers are their own and do not represent the views of U.Today. The financial and market information provided on U.Today is intended for informational purposes only. U.Today is not liable for any financial losses incurred while trading cryptocurrencies. Conduct your own research by contacting financial experts before making any investment decisions. We believe that all content is accurate as of the date of publication, but certain offers mentioned may no longer be available.
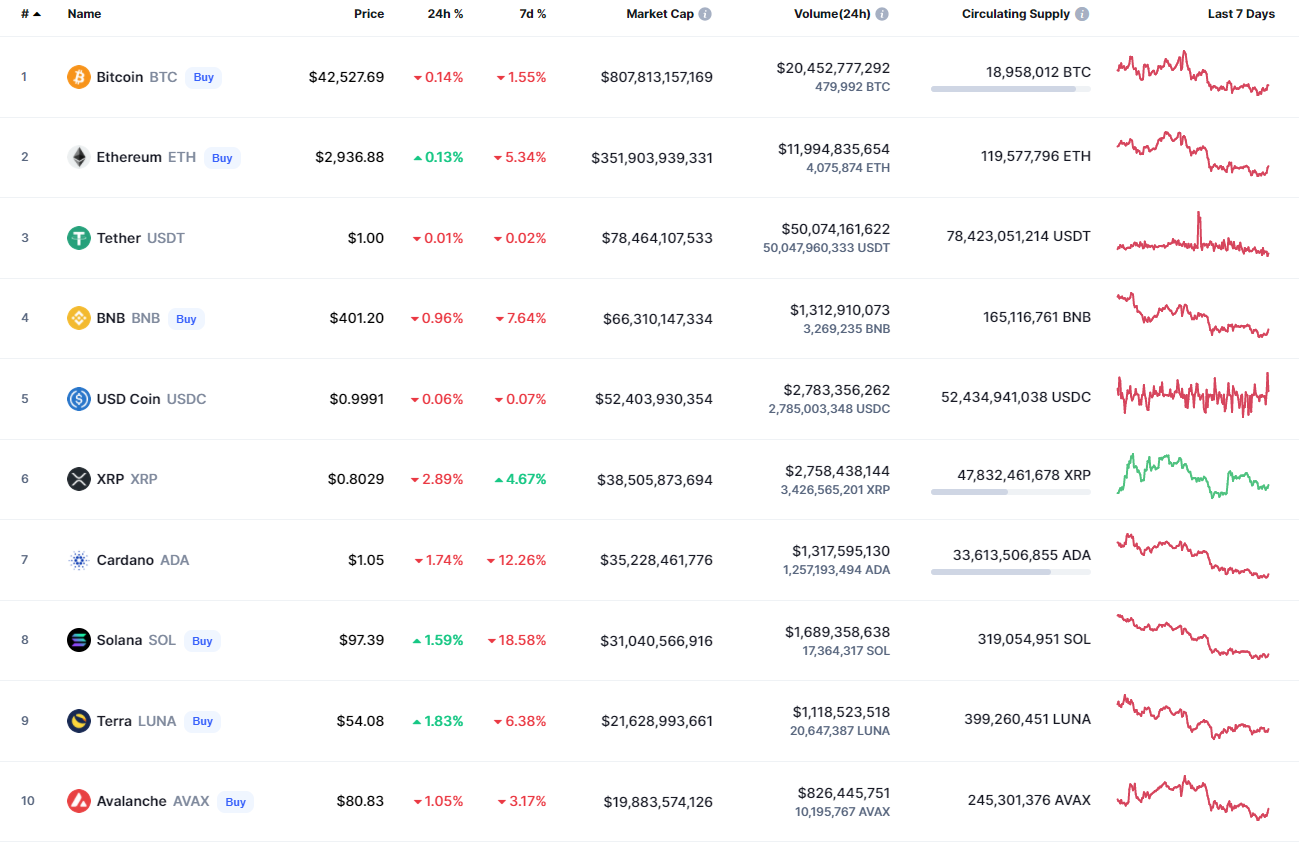
The new week has started with neutral sentiment in the market as some coins are trading in the green zone while others remain in the red.
BTC/USD
Over the weekend, buyers tried to push the price of Bitcoin (BTC) back above the two-hour EMA55 but could not overcome the resistance of the average price level.
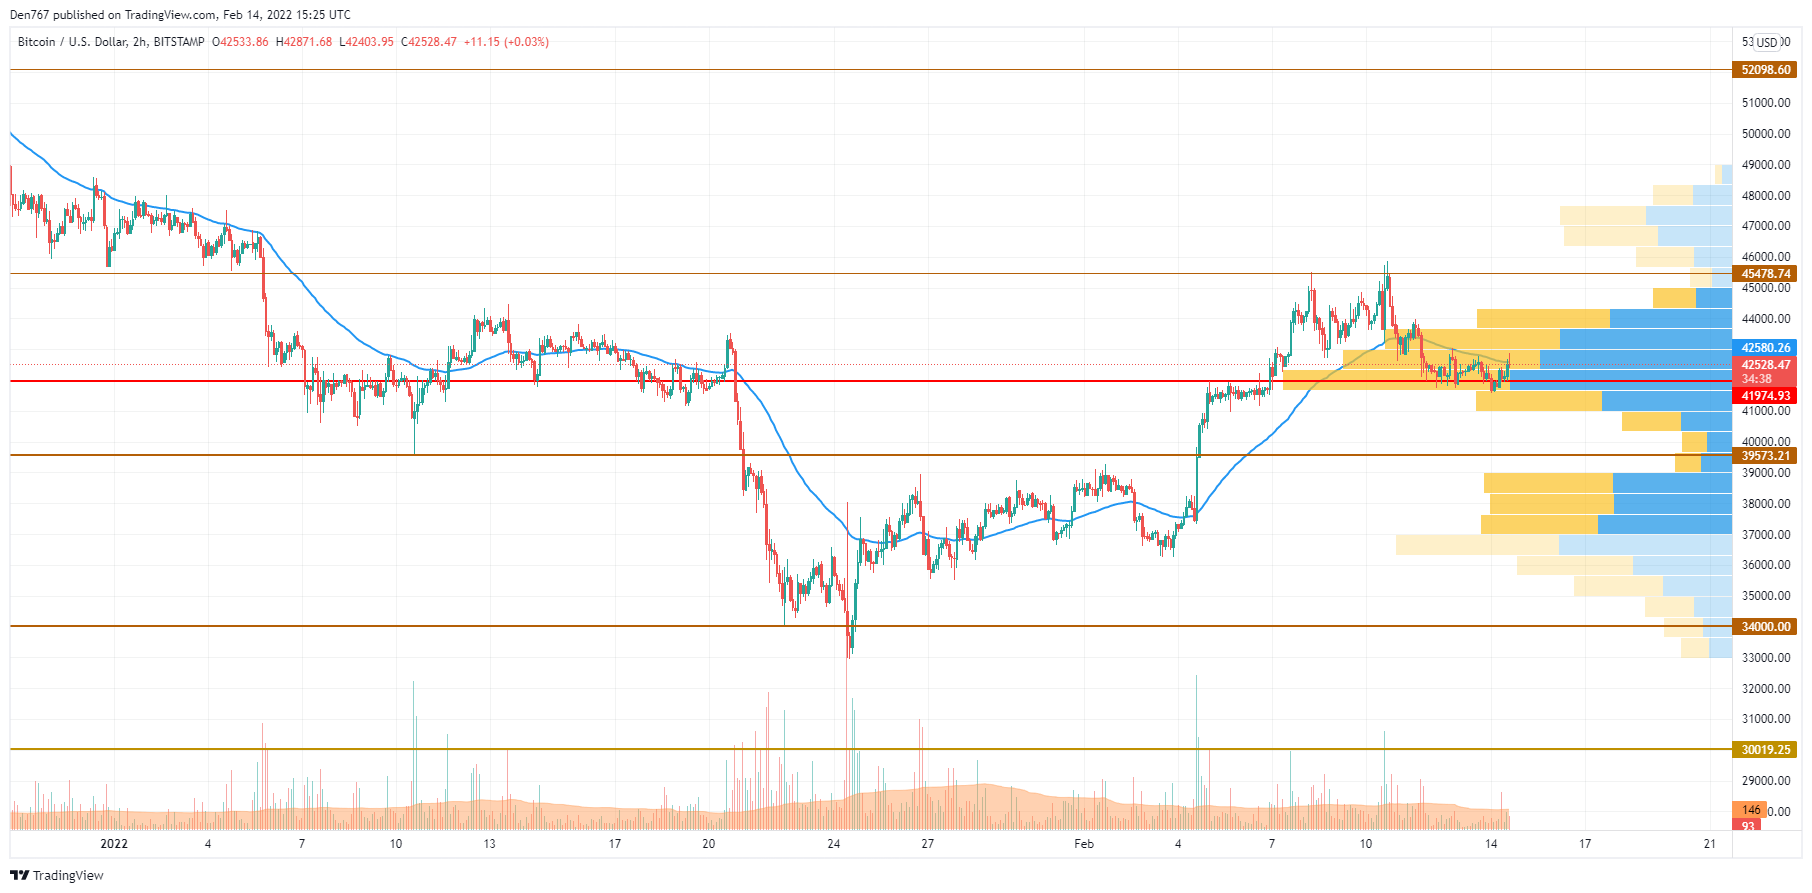
By the end of the week, the pair slipped back below $42,450, and the price of BTC tested the Point Of Control (POC) indicator line ($41,650).
If the POC line does not hold the price during short-term consolidation, then the decline can continue to the psychological level of $40,000. If bulls find support, then they may try to gain a foothold above the EMA55 moving average again.
Bitcoin is trading at $42,503 at press time.
DOGE/USD
DOGE is the main loser today, falling by more than 5% since yesterday.
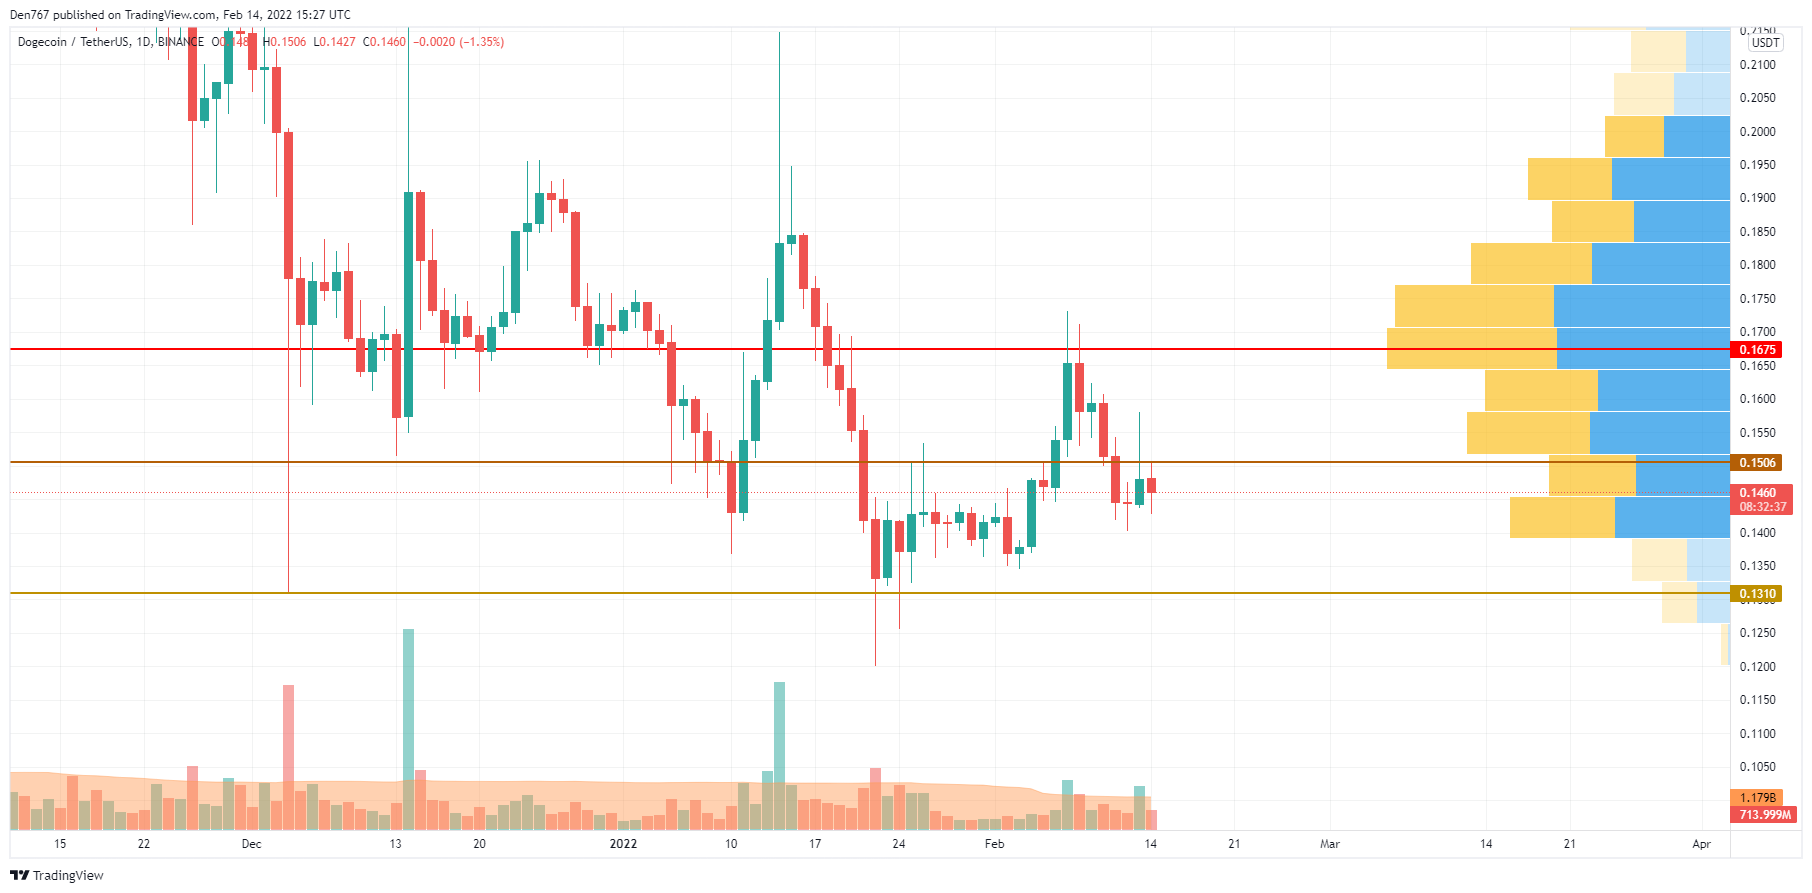
Despite the fall, the price of the meme coin is located close to the resistance level at $0.1506. Thus, the buying trading volume is going up, confirming the bulls' power.
If the daily candle fixes around the $0.15 area, there is a high chance of seeing the breakout within the next few days.
DOGE is trading at $0.1461 at press time.
SHIB/USD
SHIB is outperforming DOGE, however, it is also under the bears' pressure, going down by 4%.
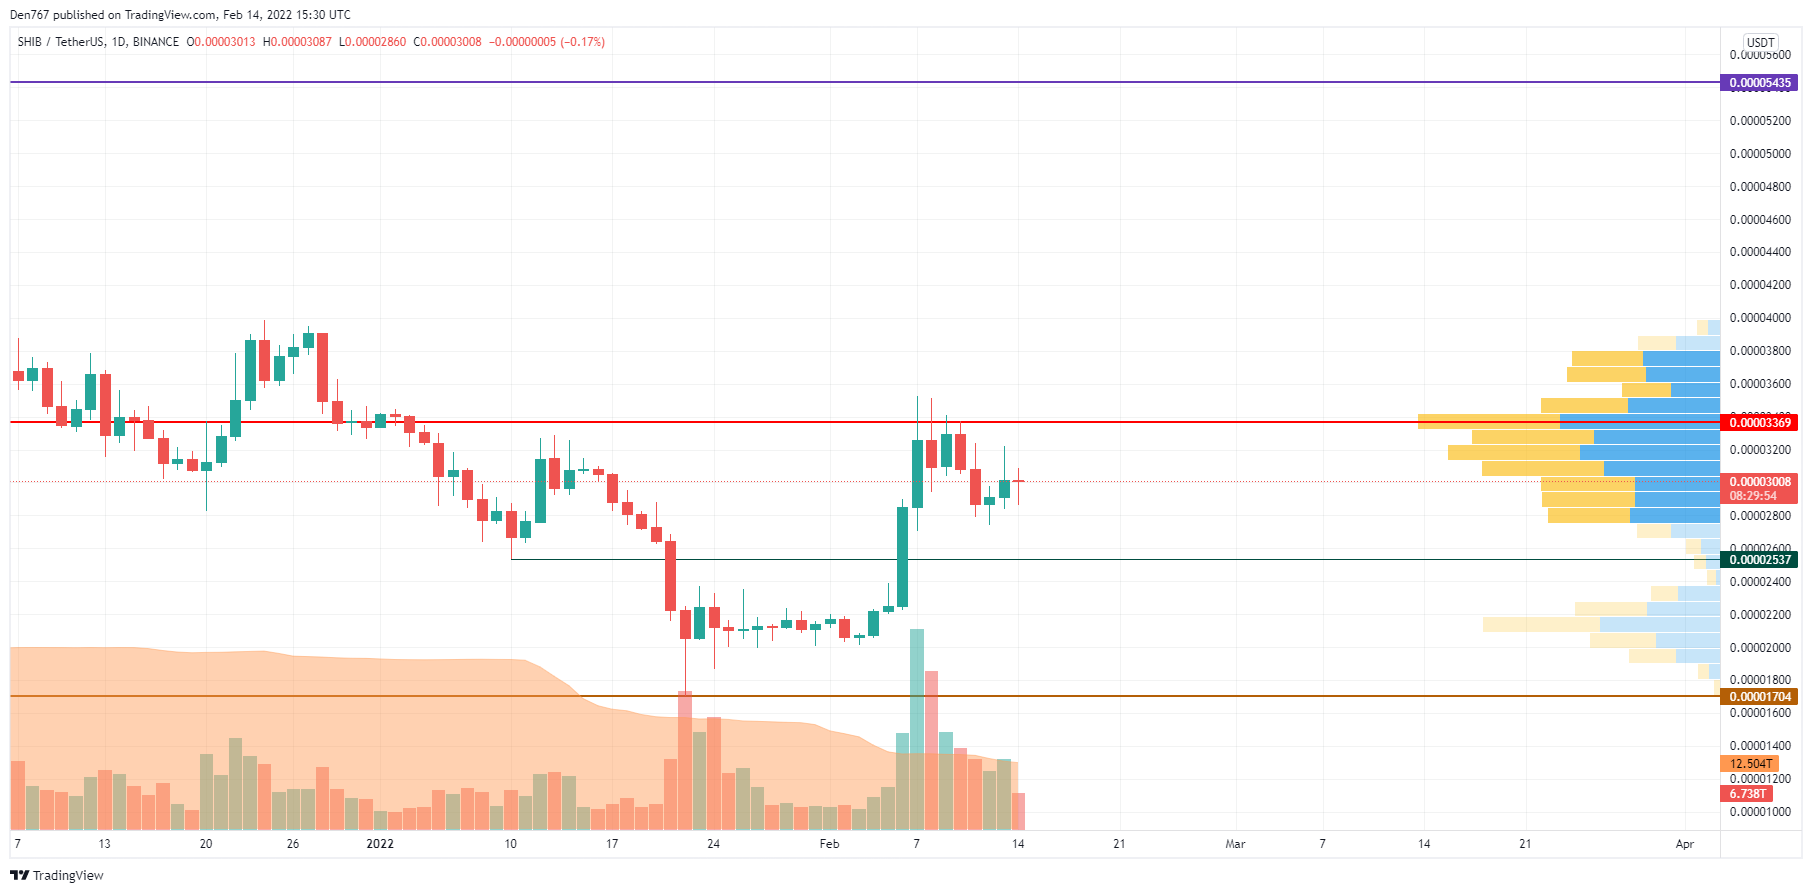
Despite the fall, SHIB keeps trading in the channel between the zone of the most liquidity, which serves as the resistance, and the support at $0.00002537. If buyers can seize the initiative and get the rate to the mark of $0.000031, the price can break the resistance and go to $0.000040 until the end of the week.
SHIB is trading at $0.000030 at press time.
 Dan Burgin
 U.Today Editorial Team