*** Please note the analysis below is not investment advice. The views and opinions expressed here are solely those of the author and do not necessarily reflect the views of U.Today. Every investment and trading move involves risk, you should conduct your own research when making a decision.
Bitcoin (BTC) breaks above the strong resistance areas
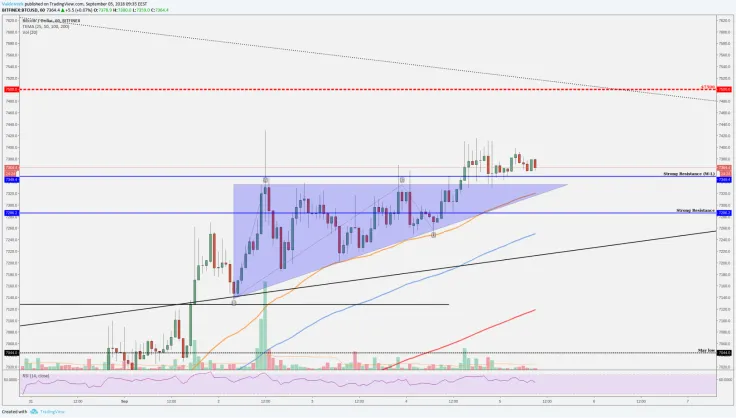
Yesterday we made a breakout of $7,349 (upper blue line). We had tried to break this five times but all attempts were unsuccessful but the bulls managed to hold the price up near the resistance and finally the sixth attempt was successful.

Bitcoin made a breakout upwards but our next resistance is not far away from us and you already know, the next resistance is $7,500-$7,600, and looks like we are going to test this area. We have a little problem, Bitcoin doesn't show the high volume, maybe this could be the only problem but let's see technically looks all very promising.
Litecoin (LTC)- have to fight with the last down-trendline
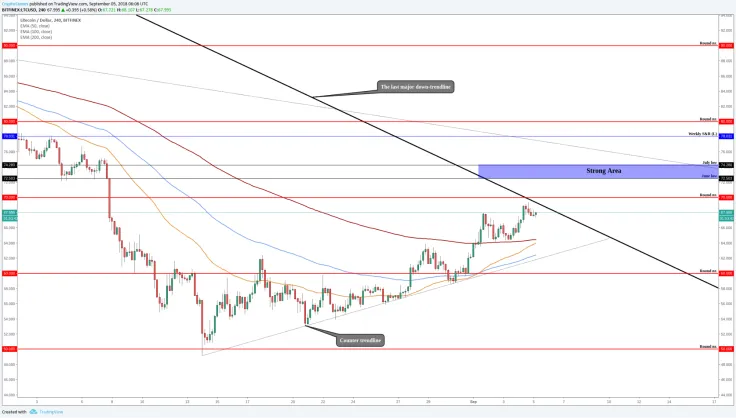
Currently, LTC price is below the round number $70 and we are still below almost the last major down-trendline pulled on the four-hour chart from the wicks. This crossing area makes it difficult to break through from here although the $70 haven't been so difficult level for Litecoin but like always those crossing areas makes it a little bit harder to break through.

If we get another leg upwards then above the trendline we have right away the very strong resistance level which consists of the July and June lows around $72-$74 and also Fibonacci retracement areas are in this level zone. We have to take down this level if we want to see a bullish Litecoin.
At the moment the price trades above the important EMA's (50, 10, 200) we have a golden cross between the 50 and 100 EMA and we are starting to make it also with 100 and 200. If we had the bigger golden cross (100&200) then we could say that the chance to go straight through from this trendline is a bit bigger change but at the moment we could make a small pullback before we can make the breakout upwards.
If we start to make a pullback then luckily we have the EMA's which works as the supports and we have a counter trendline which could work as a support. If we break below the counter trendline then this is definitely very bad for Litecoin price and we may go and retest the $50 again. Also, it depends on what the whole market does.
Ethereum (ETH) can’t find the momentum
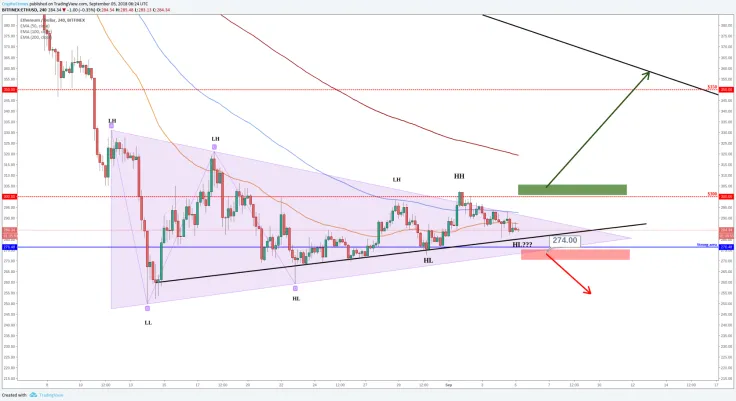
If the other altcoins make gains upwards then they break above the trendlines and they break above the EMA's but not Ethereum. ETH doesn't look good and doesn't look very bad.

Doesn't look good?
ETH price is below the EMA's and we can say that we are very far away from those down trendlines. This black line on the right upper corner is a trendline but this is not even the major trendline it is a minor and still it's far from us. If we make a breakout from the triangle and we break the round number the road to there is almost clean (from $300 to ~$350).
Doesn't look bad?
On the chart, the good signs are HH's (higher highs) and HL's (higher lows) at least ETH trying to make some moves and soon we will see a move because ETH price is approaching the triangle tip where it is squeezed together and it could explode.
Hopefully, this helps you out a little bit to confirm your own analysis. Definitely, do your own research!
 Alex Dovbnya
 Arman Shirinyan
 Denys Serhiichuk