
Gaining traction again, Bitcoin continues breaking minor resistance levels one by one, which generates positive vibes in the crypto community. What else is their optimism based on? Let’s read Bitcoin price predictions from TradingView and take a look at technical indicators. There are many interesting facts and hints to take consider.
Time to make bets!
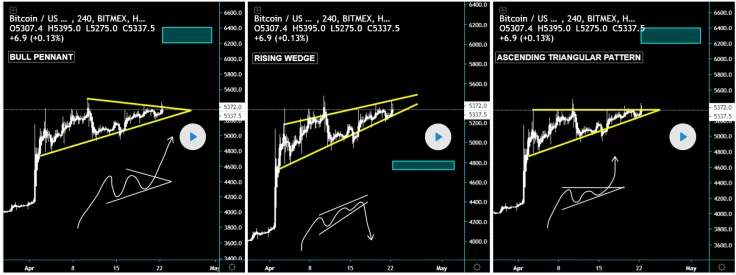
According to CryptoManiac101, there are two possible scenarios. We have three very interesting patterns, two of which are bullish, one of which is bearish and we are also working with overwhelmingly bearish indicators which have not stopped Bitcoin from doing a pump and dump thereafter.
So, what might happen? It's 50/50 at this point. You will even see that from looking at different TA's, no one really knows, but everyone has their own bias towards where Bitcoin will go in the short term.
One thing is for sure, we had more bearish signs two days ago compared to today.
-
Bull Scenario – we breakout with the target being above $6,000 - $6,400
-
Bear Scenario – we break pattern and target $4,700 - $4,800.

Bulls hold the grip of the market
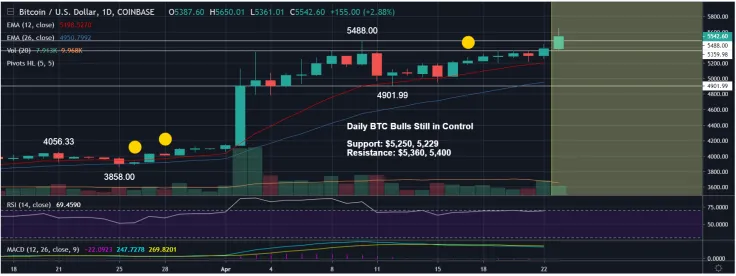
We have now seen two instances in the past couple days with a bear break of the 4-hour uptrend and no bear follow through to confirm a downtrend. The daily chart for BTC has the psychology of a cup and handle pattern with the inability to break resistance and a current bull flag.
As we see, the daily remains EMA12 support which will have to be lost as support in order for bears to gain any traction. Yesterday was another example of BTC 15 min oversold climax, signaling a good entry for bulls, with significant bounce follow through.
If we are going to see a daily continuation with BTC, it will need to come with a clear volume spike compared to recent lower volume trading the last week.
$5,700 before the correction
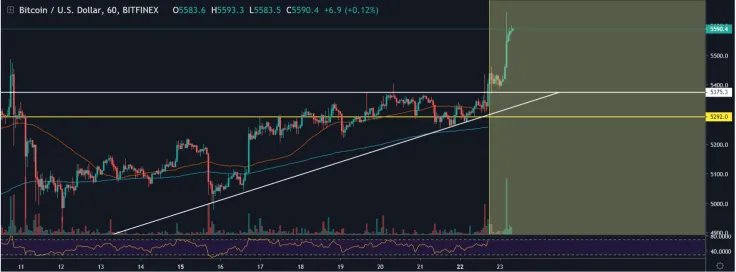
Bitcoin has been in another fight this week, attempting to set new relative highs. There has been a lot of selling pressure we have seen a few days, such as today with a few large sell orders on massive exchanges, and then similar experiences on the 10th/11th and 15th/16th.
Thus, Bitcoin is proving to be as strong as ever this past month and has been creating higher lows. Right now we are facing some heavy resistance around $5,375-$5,400. If we break above that level, BTC might be going to about the $5,700 range before correcting a bit. Otherwise, we should become cautious and set some stop losses below support for a potential correction coming. $5,200 is honestly a good spot to put a stop loss if you are trading Bitcoin on the short term, otherwise, it’s better to hold for the long run as Bitcoin is finally showing some great movement!

Why is $7,500 a possible target?
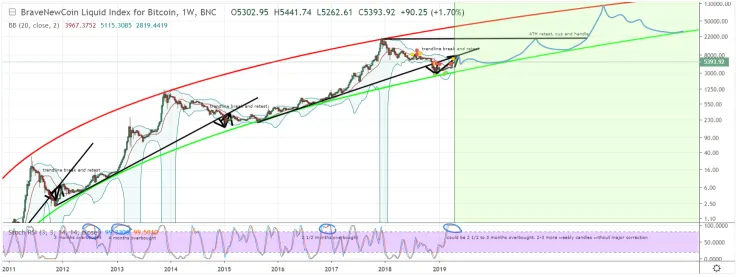
Searching for the explanation of the recent rally, FlaviusTodorius67 has analyzed Bitcoin’s previous performance and discovered something very interesting.
Every time BTC broke the previous linear trend in the logarithmic chart, it retested it not long afterward. It happened after the 2011 and 2014/15 bear market, and it seems to be happening now.
The user claims that BTC must correct because the weekly stoch RSI has been on overbought now for over 1 month. If BTC does a rally, it can stay on overbought for up to 4 months – the record of the April 2013 bubble.
We are now at almost 2 months, so it can still stay there for 2 weeks, in the extreme case even 4 weeks. Overbought for 4 months is unlikely. So this means we could see 2-4 green weeklys.
A retest of the previous linear trend would lead us to the price point of $7,500. Afterward we would see a stronger correction and retest of the long square root trendline before the rally will pick up steam in 2020, and go to new ATHs in 2021.
 Dan Burgin
 U.Today Editorial Team