
After two days of growth, the crypto market has seen a downside correction as Bitcoin and other cryptocurrencies suffered insignificant losses on Tuesday-Wednesday. However, the general situation still looks bullish and this correction is unlikely to last for long or be the game changer.
The main driver for the uptrend is news from Facebook relating their U-turn towards cryptocurrency markets and ICOs. Another driver also comes from Facebook as there are rumors that the famous social media is going to launch its own coin.
There is some less important but worth mentioning news. Ripple plans to launch a “drop.” However, this word was used to attract attention as there will be no traditional cryptocurrency drop. This time it means a new Ripple vlog narrating about the technologies crypto markets etc.
Other interesting news worth mentioning is the war of McAfee against HitBTC. The famous coin expert had some provocative comments in his Twitter accusing famous exchange in death of people and urging user to boycott this trading place.
Bitcoin (BTC/USD) price analysis, July 4
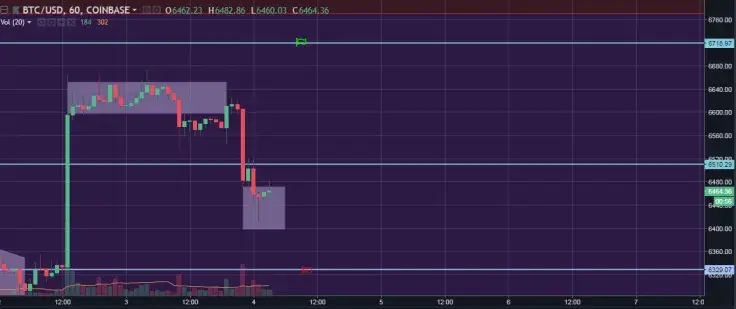
Bitcoin started a downside correction as the currency pair loses around two percent in the past 24 hours. However, we think that this correction is nothing more than just a pause of the uptrend as crypto market is still bullish. Investors fixed their positions but they are likely to resume buying in the nearest future.
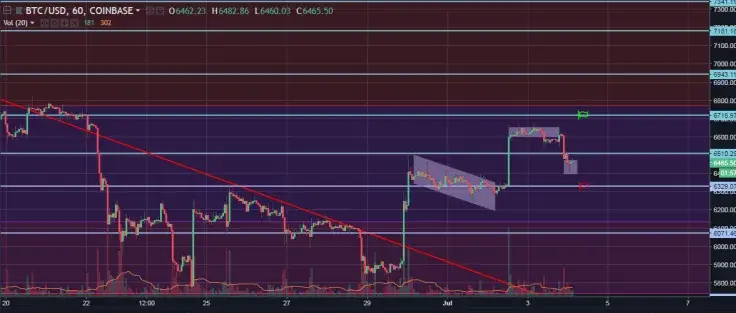
BTC/USD had a bullish flag pattern on Tuesday but failed to develop its upside progress as the price reached the support area at $6,510 and tested it. Bitcoin jumped over this level, but still has opportunities to return above the resistance (which was the support previously). We can see a clear Hammer candlestick pattern on the hourly chart meaning the currency pair is ready to grow in the nearest future.
The closest targets for Bitcoin growth lie at the resistance area at $6,718. BTC/USD is likely to start growing towards this level on Wednesday. This is the main scenario for the next 24 hours. However, if bulls fail to drive the currency pair higher, we will become witnesses of a deeper downside correction aiming at the next support area at $6,329.
Ethereum (ETH/USD) price analysis, July 4
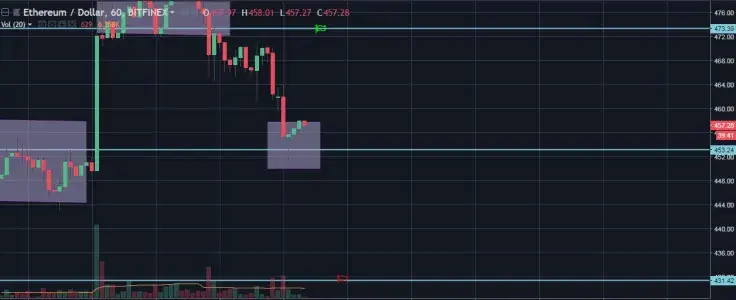
Ethereum stopped its uptrend on Tuesday as ETH price failed to work another bullish Flag. ETH/USD loses more than four percent in the past 24 hours but still looks bullish as we think this decline is nothing more than a simple downside correction to the previous uptrend.
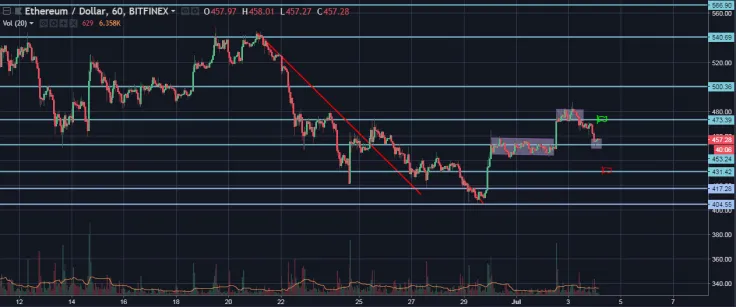
Ethereum declined on Tuesday-Wednesday and reached the support area at $453.29. The currency pair formed a bullish Hammer candlestick pattern right on its support line with a fake breakout, meaning Ethereum is ready to burst upwards again.
If this works and buyers are successful, Ethereum will be able to reach at least $473.39 resistance area. We think that this target is enough for Wednesday. However, if buyers gain momentum, they will be able to drive the currency pair even higher.
This is the main scenario for today, but we should not forget about the bears. They are also able to develop this downside correction even deeper. ETH price is likely to reach the next support area at $431.42 in this case.
Ripple (XRP/USD) price analysis, July 4
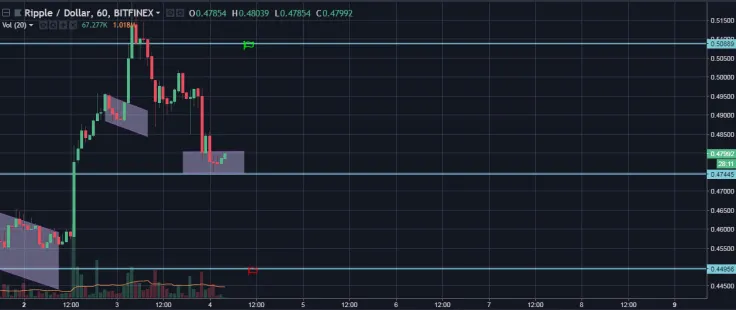
Ripple follows its rivals and develops a downside correction as the price loses almost four percent in the past 24 hours. However, XRP/USD still looks bullish and able to resume its uptrend in the nearest future.
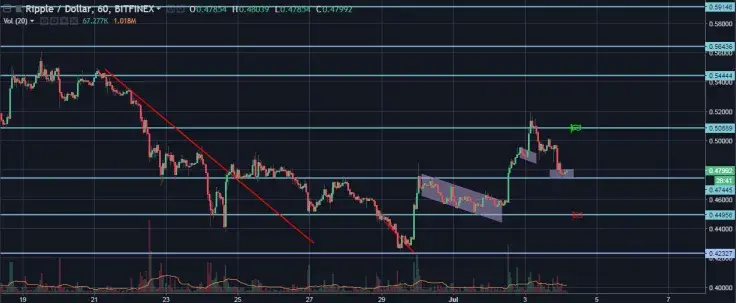
XRP/USD worked its bullish flag on Tuesday, unlike other cryptos. However, after reaching the resistance area at $0.5088, Ripple failed to jump over it and retreated from this area. XRP/USD declined towards the support area at $0.4744 and reached it later. We have a Doji candlestick, which means that Ripple is able to resume growth in the nearest future.
What are the targets for today? If bulls are successful close to this support area at $0.4744, they will be able to drive XRP/USD higher targeting the next resistance at $0.5088. Is this the final point for growth for the next 24 hours? We think that no, it is not and buyers will be able to drive XRP/USD even higher.
This is the main scenario for Ripple. However, if sellers gain momentum, they will be able to develop this downside correction towards the next support at $0.4495.
EOS (EOS/USD) price analysis, July 4
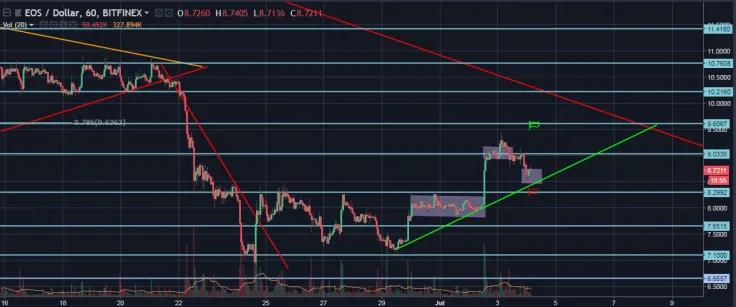
EOS developed its downside correction on Tuesday-Wednesday as EOS price failed to resume its growth after formation of a flag pattern. However, bulls are still on guards and we think they will restart the uptrend on the nearest future.
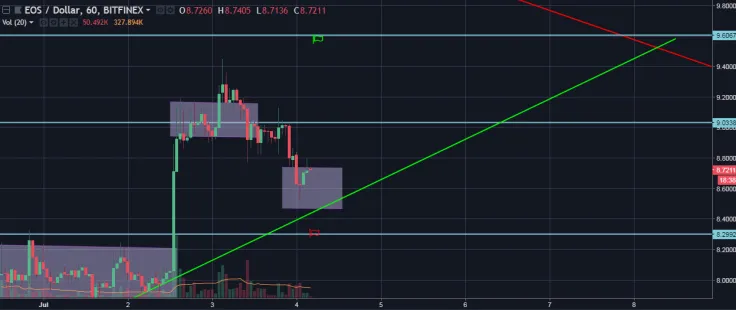
EOS/USD has broken through the support area at $9.03 and mover lower targeting the ascending trend line and the next support at $8.29. However, the currency pair stopped halfway there and we have a bullish Hammer candlestick pattern currently, which is a sign of reverse. Additionally, EOS/USD is close to the ascending trend line which gives support to the currency pair.
We think that EOS/USD will be able to resume its growth in the nearest future. The closest target for it is the resistance area at $9.03. However, we also think that EOS/USD has even more fuel and is able to reach the next resistance at $9.60 in the nearest future. This is the main scenario.
An alternative scenario for EOS/USD is bearish naturally. If sellers regain control, they will be able to push the currency pair lower through the ascending trend line.
NEM (XEM/USD) price analysis, July 4
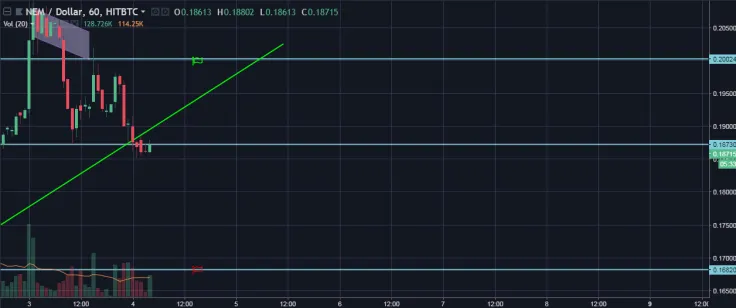
NEM Started its correction on Tuesday and the flag pattern was broken. XEM/USD loses almost nine percent in the past 24 hours. The currency pair tests the ascending trend line menacing further growth.
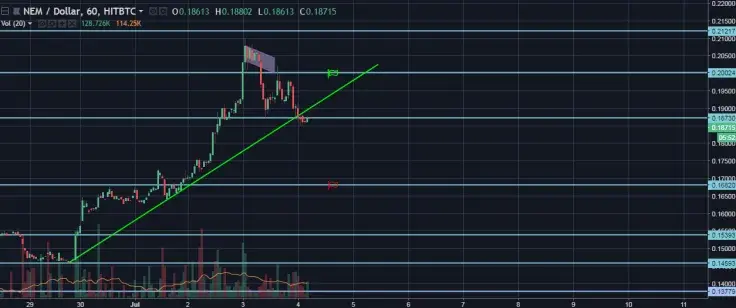
The currency pair has broken through the support area at $0.2002 and moved lower. XEM/USD reached the next support at $0.1873 later. It is close to the ascending trend line as well. We think that EOS is likely to stop its correction in the nearest future in order to resume the uptrend.
The closest target for the uptrend lies at the resistance area at $0.2002. We think that XEM/USD will be able to reach it in the nearest future. However, we also think that the growth will not be limited by this level.
This is the main scenario. As for the alternative, XEM/USD may develop its downside correction, targeting the next support at $0.1682.
 Gamza Khanzadaev
 Arman Shirinyan
 Dan Burgin
 Alex Dovbnya