
The crypto market continues to surprise as the price still goes upwards. All the majors from the top 20 have grown in the past 24 hours as we have expected. Investors seem to have completely changed their minds and coins are bullish at the moment.
What is the main reason for this? We think that news from Facebook are the biggest driver of it all. The most popular social media has not only U-turned towards cryptocurrency industry but is going to create its own crypto according to the latest rumors.
In other news, cryptos continue to expand as Middle East company is ready to sell real estate for coins. The owner of the company has a strong belief in cryptocurrencies and thinks they have changed the whole situation with transactions making them more transparent and safe as there is an opportunity to use smart contracts nowadays. The company is going to offer both cryptos and fiat money payment methods.
Bitcoin (BTC/USD) price analysis, July 3
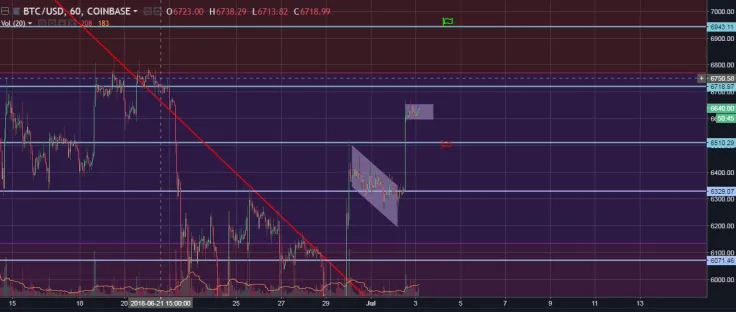
Bitcoin continues to surprise investors as it added more than three percent in the past 24 hours. The flag pattern was true and those who bought from it had chances to grow their profits. However, we think that this uptrend is still on the way as new patterns appear on the hourly chart.
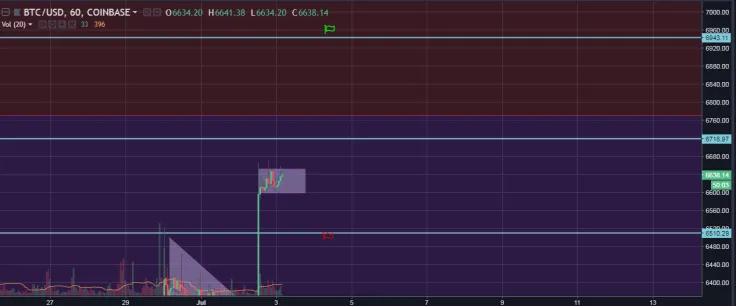
Let’s get down to the current situation. The currency pair has reached $6,510 target level on Monday-Tuesday and went even higher. However, we have some kind of a consolidation currently. BTC price resides between the resistance area at $6,718 and the support at $6,510. We have drawn another flag pattern, which is likely to be true again.
As for the perspectives for today, we think that investors still have fuel to drive BTC/USD higher. The flag pattern confirms it. However, there are two ways for Bitcoin to develop its growth. The first scenario– BTC/USD will start from the flag pattern and break through the resistance at $6,718 targeting the next resistance at $6,943.
There is also alternative growth scenario. Bitcoin will correct from its current position towards the closest support at $6,510 and start off from there. However, in this case, we expect the currency pair to reach the resistance at $6,718 at least.
Ethereum (ETH/USD) price analysis, July 3
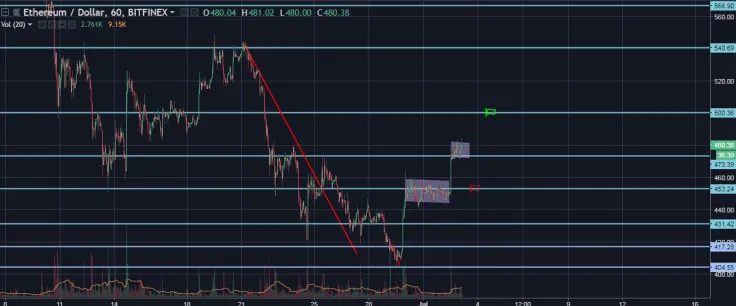
Ethereum follows its allies as the currency pair shows more than four percent growth in the past 24 hours. ETH/USD reached its targets on yesterday and tested the resistance area at $473.39. Ethereum stops there for a while but we think it has still some fuel to develop its growth on Tuesday.
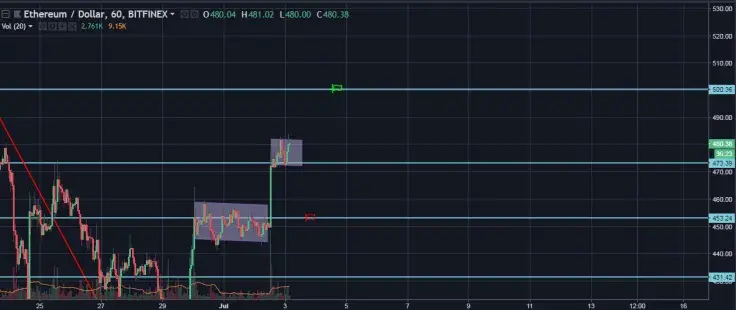
The currency pair has left the flag pattern on Monday-Tuesday and went upwards according to our expectations. Ethereum managed to jump off the support area at $453.24 and reached the resistance area at $473.39. It seems like ETH/USD has already jumped over $473.39. We have drawn another flag pattern.
The main scenario for the nearest future is bullish. We think that Ethereum will start to grow from the flag again and reach the next resistance area at $500.36. However, the currency pair may also retest the current support area at $473.39 before further growth.
Ripple (XRP/USD) price analysis, July 3
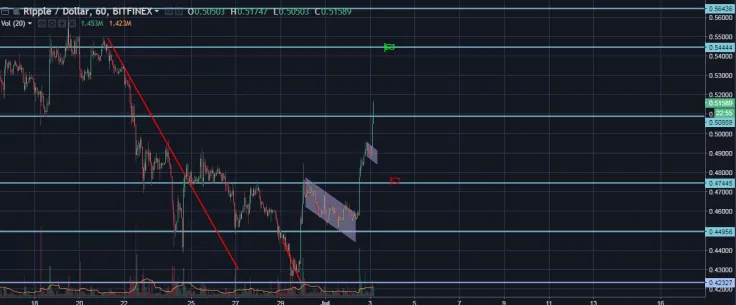
Ripple develops its upside progress on Tuesday as the currency pair reaches new highs. XRP/USD added more than five percent in the past 24 hours. The flag pattern was true and we have drawn another one which is also viable. Ripple looks very promising currently and seems to have enough power to develop its growth.
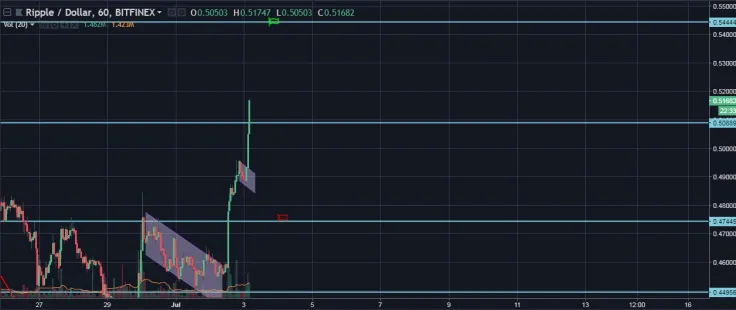
XRP/USD has jumped over the resistance area at $0.4744 on Monday-Tuesday and reached our targets. Bulls managed to drive it even higher. The currency pair works next flag pattern currently and seems to jump over the next resistance at $0.5088.
The main way for Ripple is to develop its growth in the nearest future. We have set a new target at the resistance area at $0.5444. XRP/USD is able to reach it even on Tuesday. However, we also think that it may test the support area at $0.5088 before taking off.
EOS (EOS/USD) price analysis, July 3
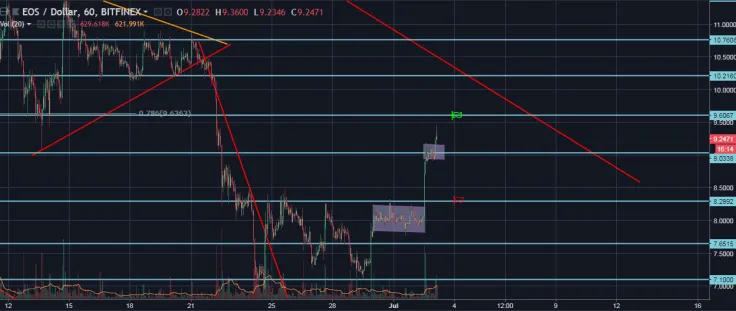
EOS is the true winner from the top 20 as the currency pair has added more than nine percent in the past 24 hours. EOS/USD worked flag pattern on Monday-Tuesday and continued its upside tendency, breaking through new resistance levels. We think that EOS can surprise us more in the nearest future establishing new tops.
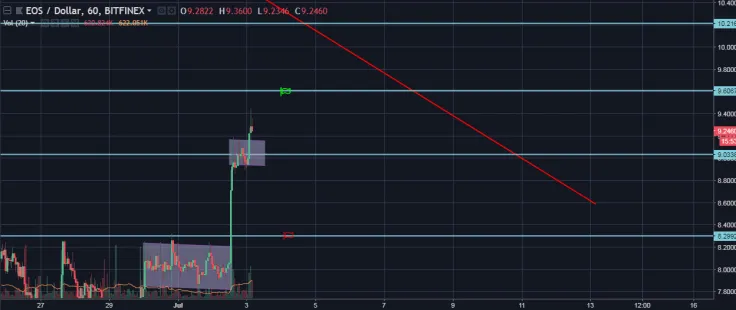
EOS managed to jump over the resistance area at $8.29 on Monday-Tuesday and move even higher. The currency pair has reached our targets already and show some signs of further growth. We have drawn another flag which is currently working. EOS looks very promising in short-term and investors enjoy this uptrend.
As for scenarios, EOS/USD is bullish currently. The currency pair has reached the resistance area at $9.03 and it seems that EOS has broken through this line with confirmation. The next target is set at $9.60. We think that EOS is able to reach it on Tuesday.
However, the currency pair may waste more time close to the current levels testing the support at $9.03 before developing its upside tendency.
NEM (XEM/USD) price analysis, July 3
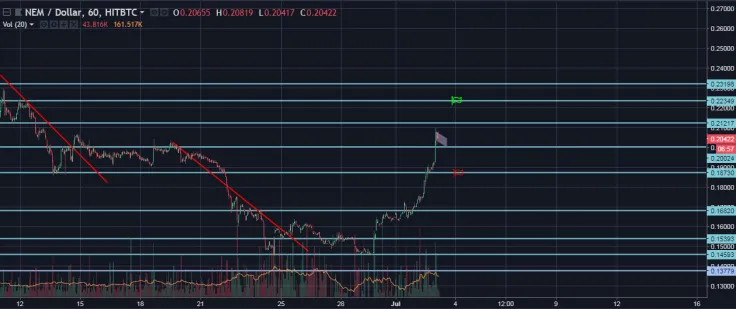
EOS is the winner? Forget it! NEM is the winner of Tuesday as the currency pair has managed to add 16 percent in the past 24 hours. Do you remember the last time NEM had such a huge growth? The currency pair has broken through several resistance areas and is consolidating currently. XEM price looks like a viper, ready to catch its new victim.
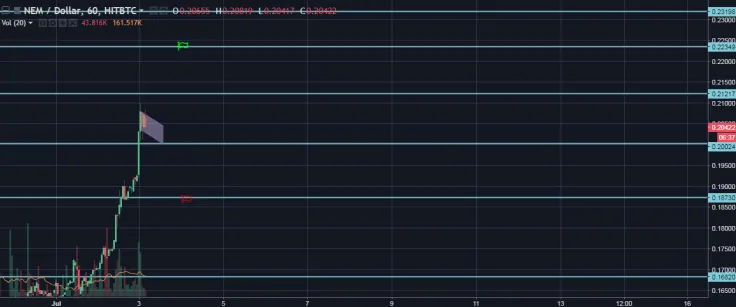
XEM/USD has reached our targets and managed to move even higher on Tuesday like Stakhanov (a famous Soviet miner, who exceeded plans several times and was a Soviet Hero). The currency pair jumped over resistance areas at $0.1873 and $0.2002. XEM/USD consolidates in the moment of writing, but we have already drawn a flag pattern meaning the currency pair is able to develop its growth again.
As for scenarios, NEM still has fuel to grow. If the flag is true, XEM price will target the next resistance level at $0.2121 at least. However, we see XEM/USD to reach even higher levels at $0.2234 in the nearest future. Do not forget that XEM/USD is able to test the current support area at $0.2002.
 Vladislav Sopov
 Dan Burgin