
Disclaimer: The opinions expressed by our writers are their own and do not represent the views of U.Today. The financial and market information provided on U.Today is intended for informational purposes only. U.Today is not liable for any financial losses incurred while trading cryptocurrencies. Conduct your own research by contacting financial experts before making any investment decisions. We believe that all content is accurate as of the date of publication, but certain offers mentioned may no longer be available.
After 2 days of growth, a slight correction on the cryptocurrency market has appeared. Most of the top 10 coins are trading in the red zone, while the main loser is EOS, whose rate has dropped by 1.45% since yesterday.
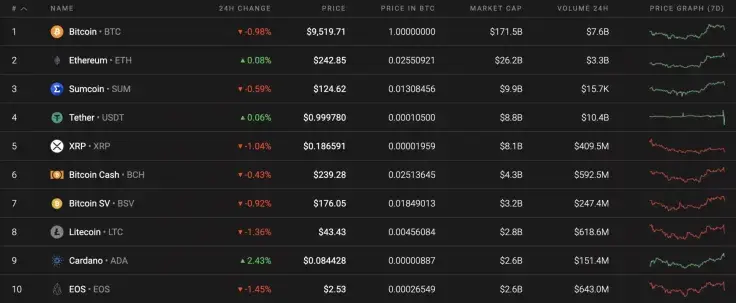
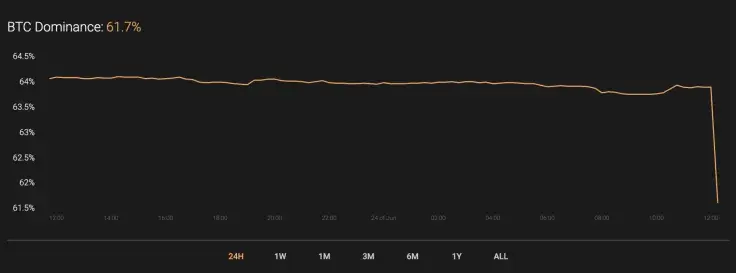
The dominance rate of Bitcoin (BTC) has been drastically affected by the price action of altcoins. Respectively, its market share has lost 3%.
The relevant data for Bitcoin is as follows.
-
Name: Bitcoin
Advertisement -
Ticker: BTC
-
Market Cap: $175,685,262,338
-
Price: $9,541.26
Advertisement -
Volume (24h): $16,973,458,807
-
Change (24h): -0.93%
The data is relevant at press time.
BTC/USD: Is the current drop a correction before a move closer to $10,000?
Yesterday, trading volumes again fell below the average level and buyers were unable to continue recovering the rate of Bitcoin (BTC). The pair hovered in consolidation with support in the region around $9,600.
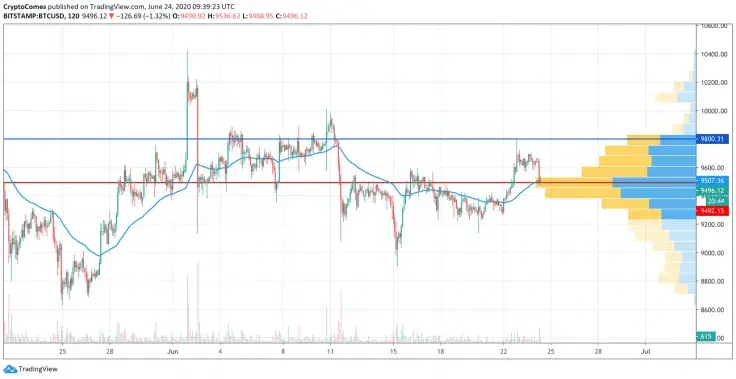
Today, buyers will try to increase volume and overcome the resistance at $9,800. The purpose of the breakthrough is to re-test the psychological mark of $10,000, but if sellers keep the defense at the turn of $9,800, they will roll the Bitcoin price back below the two-hour EMA55, to the 38.2% Fibo ($9,441) support.
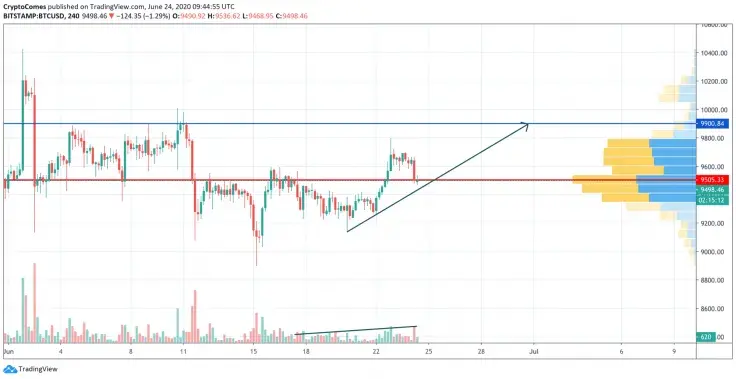
On the 4H chart, the growth may continue as buyers have become more active in the past days, which is confirmed by rising trading volume. In this case, if bulls can hold $9,400, the next target is the zone around $9,900. The only thing that might be an obstacle is the low liquidity level near the $10,000 mark.
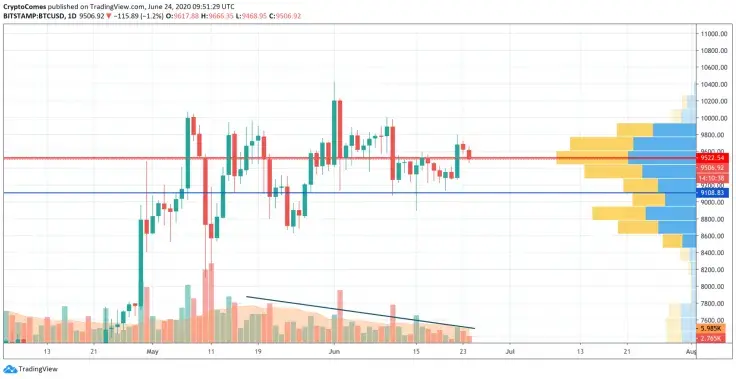
On the bigger time frame, nothing has changed yet. The trading volume is declining while Bitcoin (BTC) is slowly rising. The growth, which is not accompanied by trading volume, is not going to last for a long time. Respectively, after the possible local peak at around $9,900, traders should expect a drop to $9,100 which has been a support area since the beginning of May 2020.
Bitcoin is trading at $9,505 at press time.
 Dan Burgin
 U.Today Editorial Team