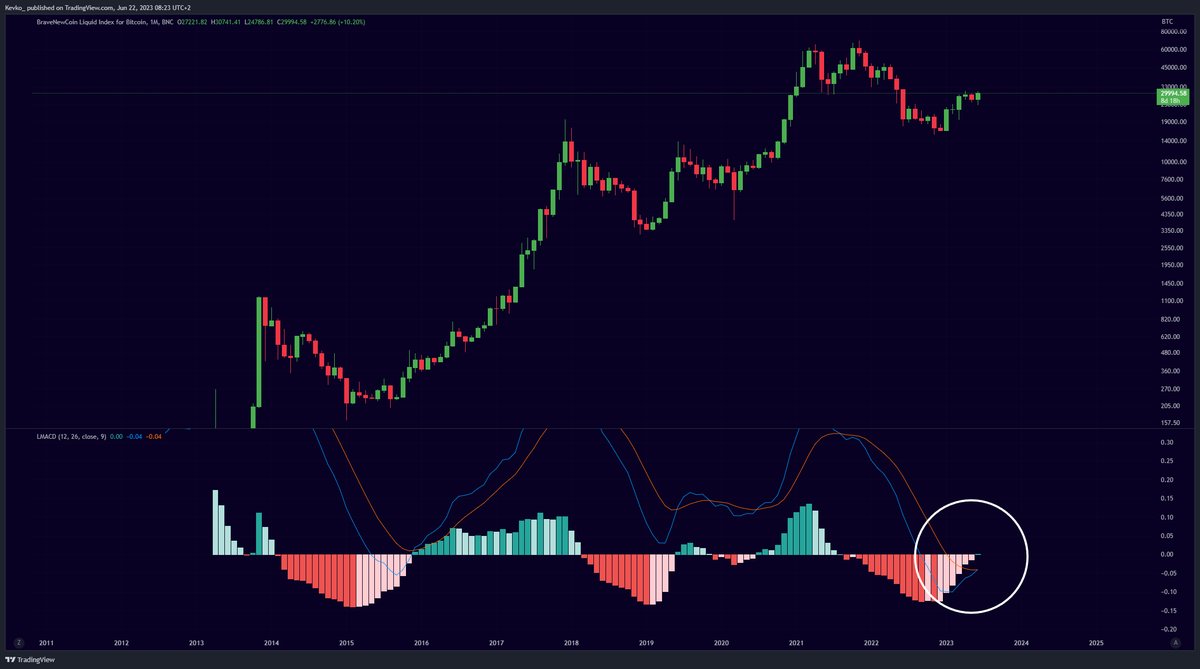
Bitcoin, the world's leading cryptocurrency, has just flashed a significant bullish signal, with its moving average convergence divergence (MACD) crossing into bullish territory for the first time since late 2021.
This key momentum indicator might be forecasting an upcoming rally as Bitcoin's value surges past the $30,000 mark for the first time since April 19 due to the hype surrounding a slew of exchange-traded fund (ETF) filings from major firms such as BlackRock and Invesco.

The MACD, a vital tool for traders, is a trend-following momentum indicator that illustrates the connection between two moving averages of an asset's price. The MACD consists of the MACD line and the signal line. The MACD line is obtained by subtracting the 26-period exponential moving average (EMA) from the 12-period EMA, while the signal line is a 9-day EMA of the MACD line.
When the MACD line crosses above the signal line, it is considered a bullish signal, indicating it might be an opportune time to buy. Conversely, a bearish signal is given when the MACD line crosses below the signal line, suggesting it could be a good time to sell.
In Bitcoin's case, the recent MACD crossover into bullish territory can be seen as an indication of potential positive price momentum in the near future. However, as with all trading indicators, it should be used in conjunction with other indicators and analysis techniques to confirm signals and avoid false positives.
At the time of writing, Bitcoin is trading at $30,115.
 Arman Shirinyan
 Alex Dovbnya
 Denys Serhiichuk
 Gamza Khanzadaev