Disclaimer: The opinions expressed by our writers are their own and do not represent the views of U.Today. The financial and market information provided on U.Today is intended for informational purposes only. U.Today is not liable for any financial losses incurred while trading cryptocurrencies. Conduct your own research by contacting financial experts before making any investment decisions. We believe that all content is accurate as of the date of publication, but certain offers mentioned may no longer be available.
As the week wraps up, we get that familiar moment of market reflection - Bitcoin's weekly candle closing. It is the kind of checkpoint that does not just summarize the last seven days but also sets the stage for what is to come. A rejection, a continuation or maybe the beginning of something entirely different - it is all up to how that final candle prints.
But numbers alone do not tell the full story, and that is where the Bollinger Bands come in.

Think of them less as indicators and more as flexible boundaries that constantly adapt to price behavior. The middle band, a moving average, acts as a gravitational pull, while the outer bands expand and contract with volatility, giving traders a sense of when the price might be stretching too far in one direction.
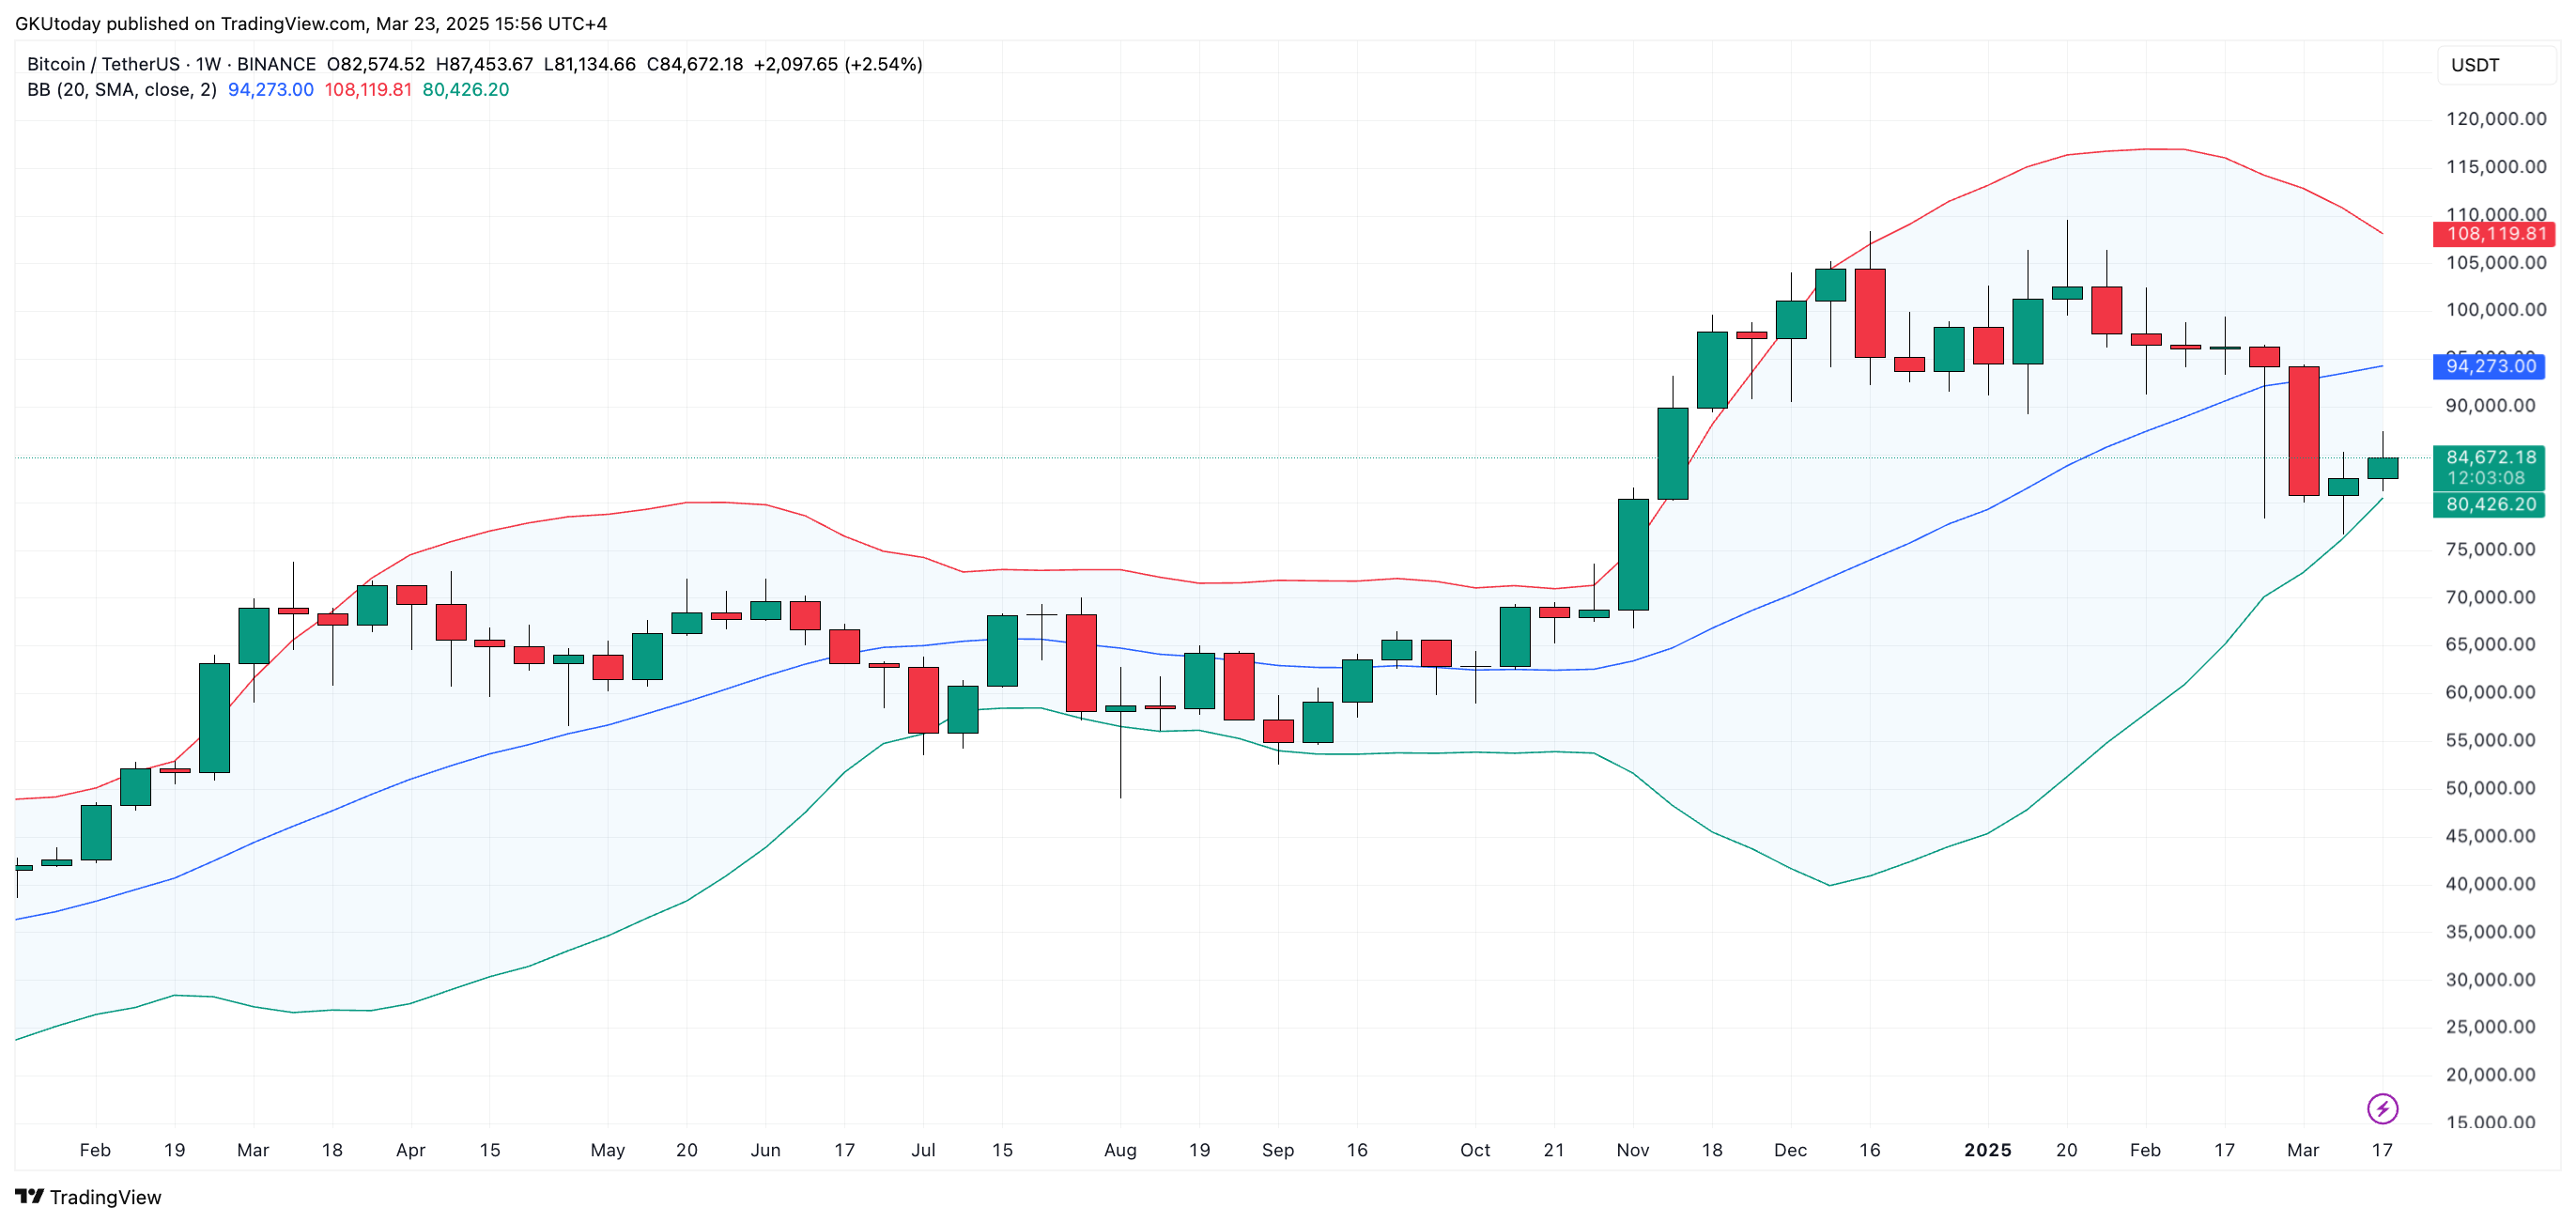
For the second week in a row, Bitcoin (BTC) has been hanging out near the lower Bollinger Band, not breaking through but bouncing off it - twice now. And that is not just a random move.
Usually, when the price finds support at this lower level and holds, it is a sign that there is at least a temporary floor, an area where selling pressure fades and buyers start stepping in. If this pattern keeps up, the next thing to watch is the middle band at around $94,300, which is about 11.25% higher than where it is now.
None of this suggests a quick breakout. That is just how the weekly time frame works.
Candles there move slowly, and their signals tend to play out over weeks, not days. So, while this is not a short-term call to action, it is a midterm nod to the idea that Bitcoin might be building a base here, a foundation for something bigger.
 Dan Burgin
 U.Today Editorial Team