Disclaimer: The opinions expressed by our writers are their own and do not represent the views of U.Today. The financial and market information provided on U.Today is intended for informational purposes only. U.Today is not liable for any financial losses incurred while trading cryptocurrencies. Conduct your own research by contacting financial experts before making any investment decisions. We believe that all content is accurate as of the date of publication, but certain offers mentioned may no longer be available.
The altcoins market still suffers from the current downtrend. However, it looks attractive, as there are some signs of a possible reverse. A correction may start at least.
BNB/USDT still suffers from the global altcoin downtrend
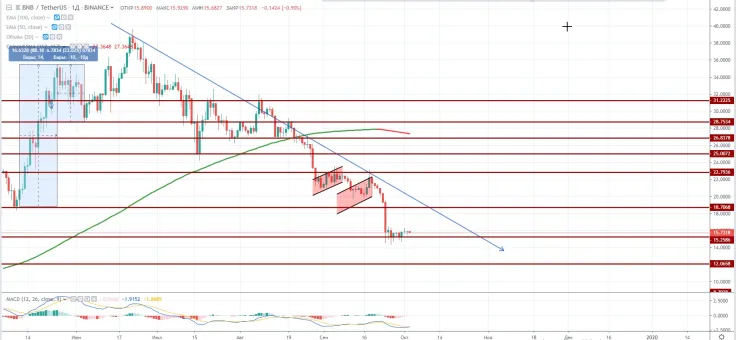
BNB/USDT develops its downtrend after two flags in a row on the Daily chart. The currency pair still stays below the descending trend line meaning there are no chances for the bulls currently to change the situation. BNB/USDT has met the support area at 15.2586 but bounced off this line with several hammer-like candlesticks.
We expect the currency pair to start a correction aiming at the closest 18.7068 resistance area, which is crossed by the descending trend line. If this local formation ends with another flag or pennant pattern, BNB/USDT may sharply collapse to the next support area at 12.0658.
Important Figures:
-
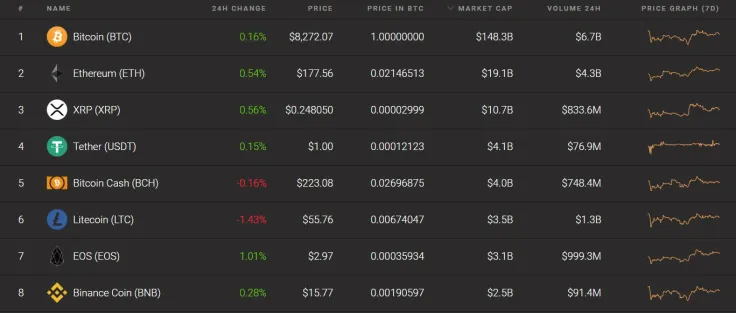
24H price changes: +0.28%
-
Total 24H volume: $91.4
-
Total Market Cap: $2.5B
Advertisement
LTC/USDT meets the descending trendline
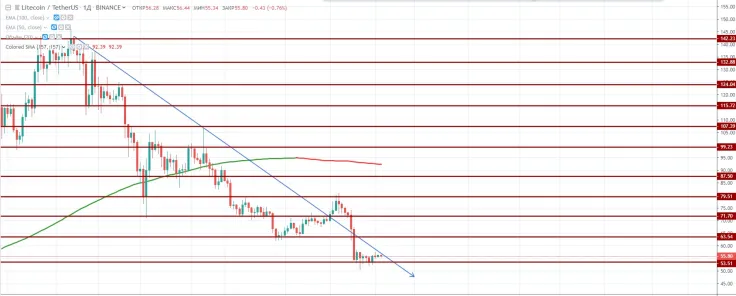
LTC/USDT follows the main altcoin trend. The currency pair reached another support at 53.51 and failed to drop further. Litecoin seems to pause the downtrend here to gather buyers or sellers in order to make some noise again.
The currency pair has met the descending trend line on the Daily chart and LTC is likely to test it in the nearest future. In case of positive result, the altcoin will be able to break out the trend line and move higher targeting the closest 63.54 resistance line.
Another scenario for the Litecoin looks like the following: the currency pair fails to break out the descending trend line and drops below the current support targeting the next one at $42.09. Litecoin takes the sixth rank according to Coinstats.
Important Figures:
-
24H price changes: -1.43%
-
Total 24H volume: $1.3B
-
Total Market Cap: $3.5B
XLM/USDT takes a break before the next run
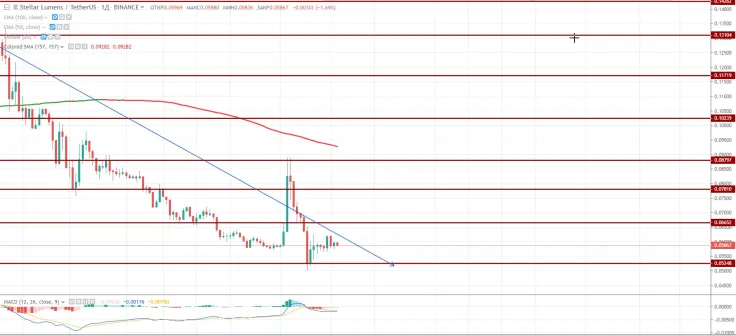
Stellar looks comfortable now. The currency pair is close to the descending trend line and managed to make a significant upside spike previously. XLM/USDT has tested the support at 0.05248 and bounced off, leaving some hopes to the bulls. However, the descending trend line still prevents the price from moving higher. It is better to monitor the situation and wait until the price breaks out either the trend line or the closest support at 0.05248
Important Figures:
-
24H price changes: +0.44%
-
Total 24H volume: $92.6M
-
Total Market Cap: $1.2B
 Dan Burgin
 U.Today Editorial Team