Disclaimer: The opinions expressed by our writers are their own and do not represent the views of U.Today. The financial and market information provided on U.Today is intended for informational purposes only. U.Today is not liable for any financial losses incurred while trading cryptocurrencies. Conduct your own research by contacting financial experts before making any investment decisions. We believe that all content is accurate as of the date of publication, but certain offers mentioned may no longer be available.
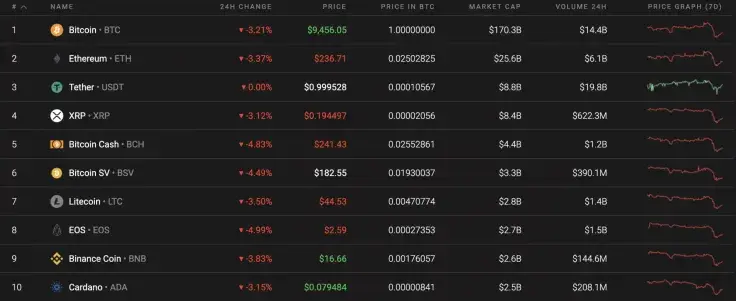
The market is trying to recover after yesterday’s fall; however, this will unlikely happen as all the coins from the Top 10 are located in the red. EOS is the biggest loser, having declined by 4.99% since yesterday.

Meanwhile, the dominance rate for Bitcoin (BTC) has remained unchanged since yesterday. Its current value sits at 64.5%.

Below is the relevant data of XRP and how it's looking today:
-
Name: XRP
Advertisement -
Ticker: XRP
-
Market Cap: $8,631,282,827
-
Price: $0.195664
Advertisement -
Volume (24H): $1,453,067,853
-
Change (24H): -3.08%
XRP/USD: Has the Time Come to Start Opening Shorts?
XRP has faced much more of a decline than Bitcoin (BTC) or Ethereum (ETH). The coin has lost almost 3% since yesterday, while the weekly decline is 4.18%.

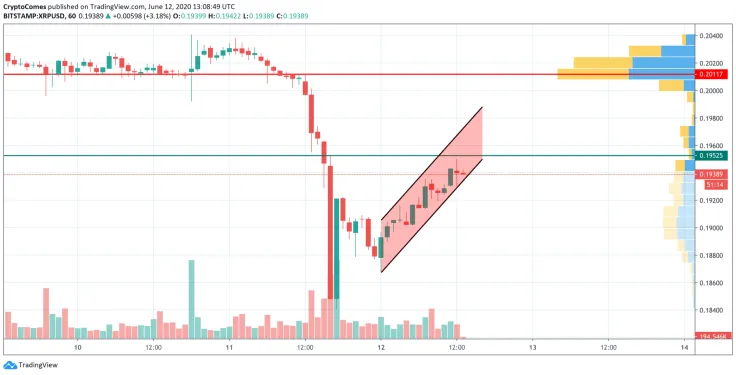
June 12th started with a bounce back; however, this will likely end soon as the bulls are running out of fuel. A short growth outlook is also not accompanying the trading volume, which is a signal that a more profound decline may start soon. As for a more likely scenario, a drop may start from XRP's current levels or a false breakout at the $0.19525 mark, followed by a decrease in price.

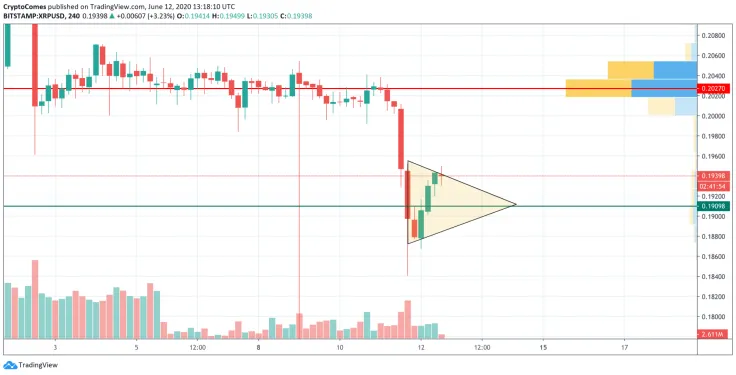
Looking at the bigger time frame, bears have confirmed their efforts to push the price of XRP down. There was no lengthy bottom wick, which means that sellers have seized on the initiative. Once XRP finishes its correction after its dump, the cryptocurrency may go to its nearest support level at $0.1910. In this particular case, the coin will form a triangle pattern on the 4H chart.

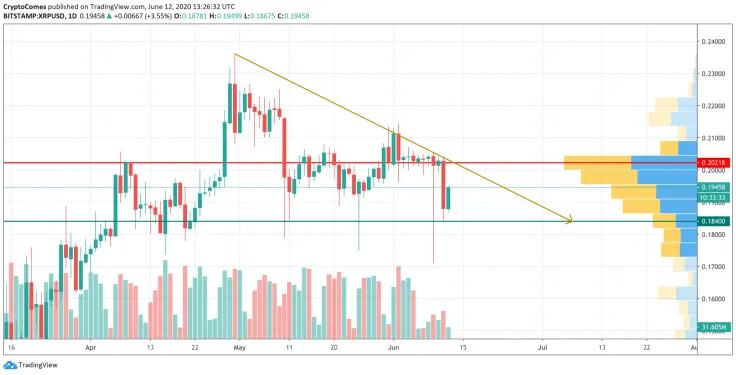
Looking at the daily chart, the downtrend has not been broken, confirming the lack of the bulls' strength to continue the upswing. The trading volume has declined sharply over the last few days, which is a bearish sign. In this regard, a drop is more probable than a rise, reaching the $0.1840 support level by July 2020.
At press time, XRP was trading at $0.1942.
 Dan Burgin
 Gamza Khanzadaev
 Arman Shirinyan