
Disclaimer: The opinions expressed by our writers are their own and do not represent the views of U.Today. The financial and market information provided on U.Today is intended for informational purposes only. U.Today is not liable for any financial losses incurred while trading cryptocurrencies. Conduct your own research by contacting financial experts before making any investment decisions. We believe that all content is accurate as of the date of publication, but certain offers mentioned may no longer be available.
A nine trillion SHIB drop in activity on the network is not what you want to see right now on Shiba Inu, putting the company under fresh strain. In a market that is already unstable, on-chain activity is still one of the most crucial measures of demand and utility, and this decline has heightened pessimism.
Pushing to end
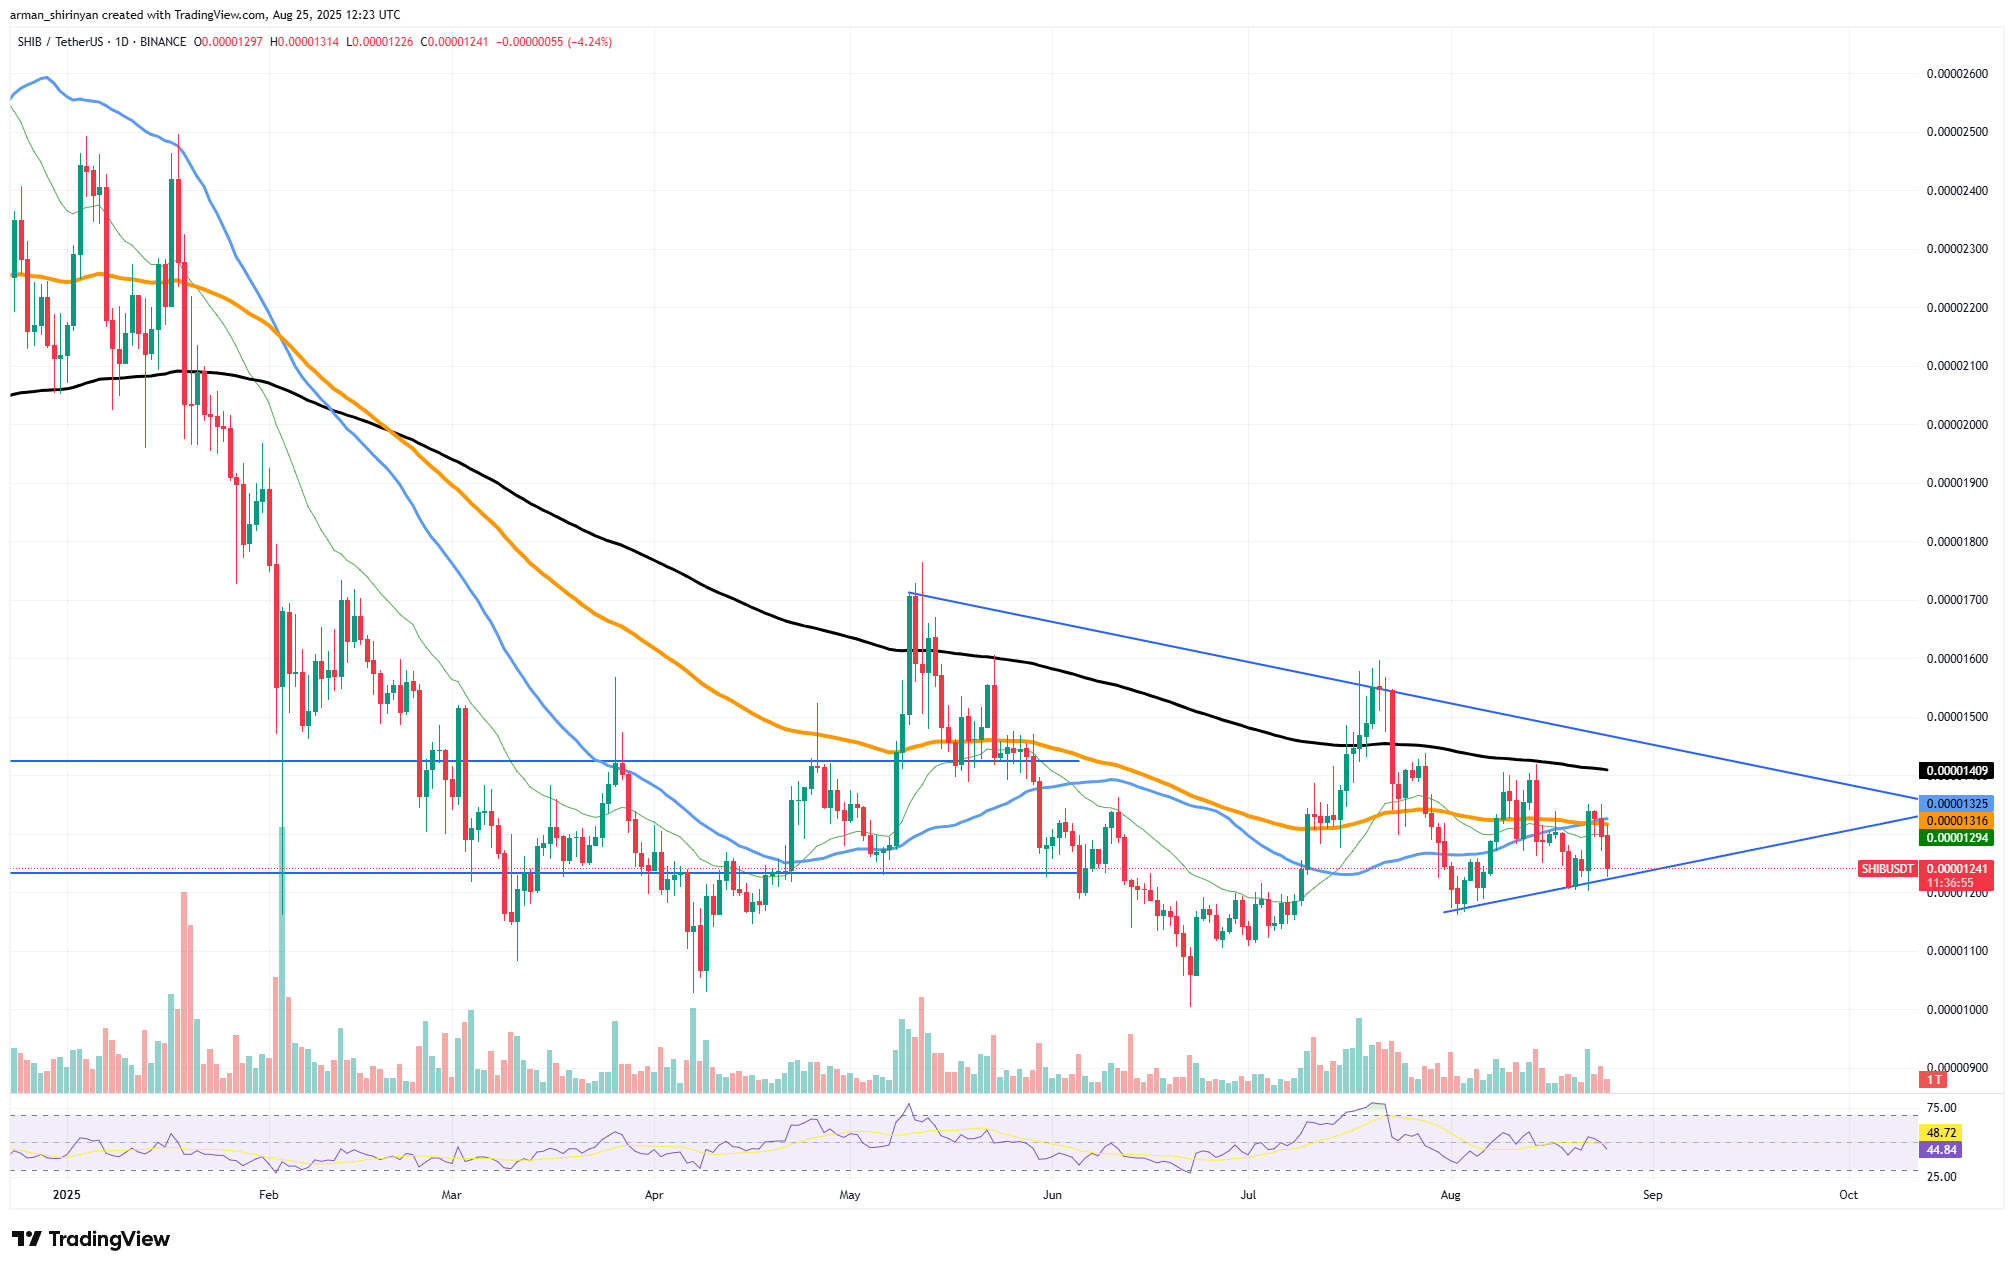
Technically speaking, SHIB is still trading within a wide symmetrical triangle pattern, and its price is centered around $0.0000123. For months, this structure has been evolving, showing a narrowing range as traders wait for a clear move. The issue facing SHIB is that network fundamentals no longer lend credence to the idea of an upside breakout. Since token circulation and transaction volume have dropped so sharply, price momentum has begun to wane.
The decline of nine trillion SHIB in network activity indicates a decline in participation from both retail investors and whales. Since SHIB has previously experienced daily activity swings of more than 10 trillion tokens, it is clear that although such numbers are not uncommon, the current decline occurs at a delicate moment when the asset is already experiencing psychological and technical stress.
SHIB not breaking out
SHIB has been unable to consistently break above its major moving averages on the chart, including the 100-day EMA, which remains a resistance level. A significant shift toward the $0.0000110 zone could result from any breakdown below the triangle’s lower boundary, which is becoming more and more crucial.
Around 45, the RSI indicator is in neutral territory, indicating that the market is neither overbought nor oversold. Nonetheless, the lack of substantial volume indicates that traders lack the confidence to start aggressive positions.
If SHIB fails to observe a resurgence of whale activity, or ecosystem advancements that stimulate demand, the recent loss of the network could result in sustained vulnerability. The key levels to keep an eye on in the short term are still the $0.0000120 support and the $0.0000135 resistance. A deeper correction and more difficult weeks for the meme token may result from the significant network decline if SHIB is unable to regain higher ground.
 Dan Burgin
 U.Today Editorial Team